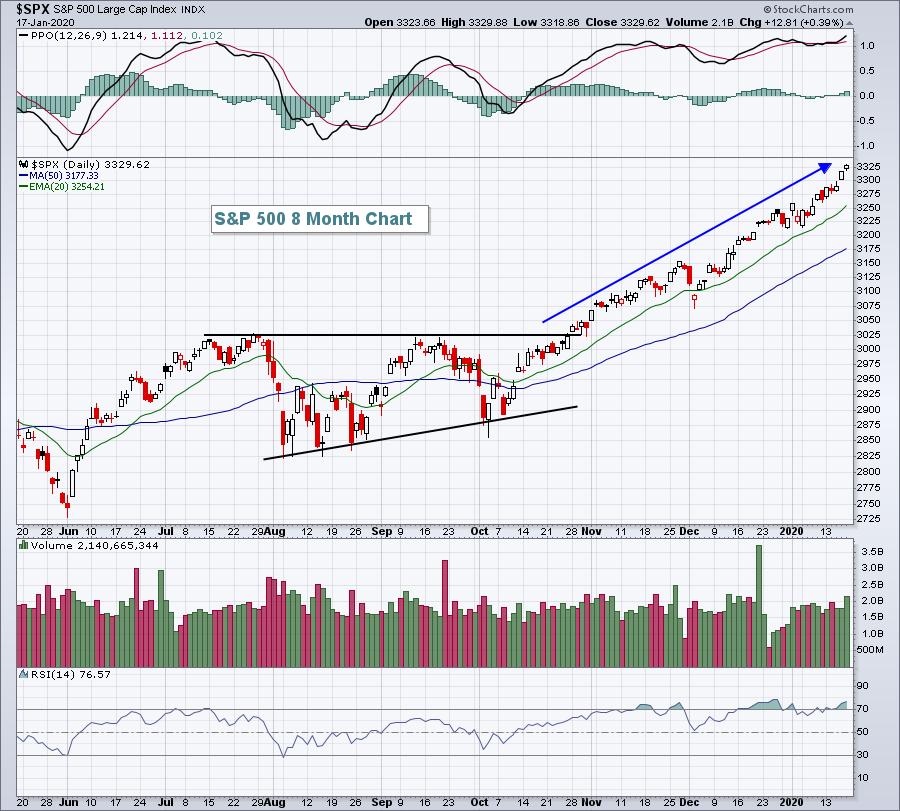
Calling tops in a secular bull market advance is not typically a wise thing to do, because it rarely works. But it's very difficult to ignore sentiment readings that border on the absurd. Three months ago, the S&P 500 broke out of a bullish ascending triangle that measured another 7% higher. At the time, I suggested we'd see it by December 31st.... and we did. I received a number of emails questioning my rationale of moving up so quickly, what with the trade war, economic contraction in manufacturing, the political environment, etc. The beauty of the charts is that all known information is already priced in. I can make my calls based on the price action; I don't need to always look over my shoulder at the news headlines. We're now higher by more than 10% from that breakout above 3025:

In case you haven't seen it, I've made a prediction that the S&P 500 will see 4000 before this year ends. It may have looked really crazy 6 months ago, but it's not quite so crazy anymore. It won't be straight up, however. We'll have our normal ebbs and flows with short-term greed and fear helping to direct traffic. Currently, greed is taking over. No one wanted to buy U.S. stocks when the headlines centered on the trade war. We were doomed! 500 points later and now everyone is speculating and buying calls. That's how the market works. The masses usually arrive late to the party.
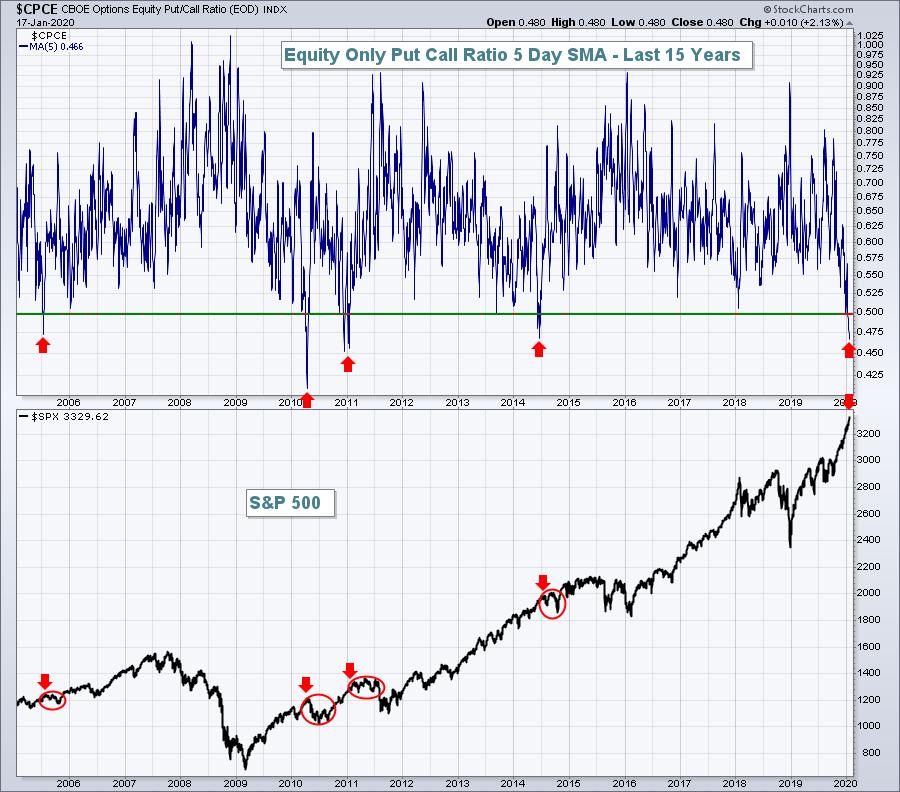
Hey, I'm as bullish as anyone out there, but I also recognize when a good short-term thing has gotten too good. Have you noticed the equity-only put call ratio ($CPCE)? I like to look at it on a 5-day SMA in order to get a feel for investor sentiment. Everyone is CRAZY bullish right now and that can be a scary thing. The 5-day SMA has fallen to .48 and there's only been 2 lower readings in the past 15 years. Everyone is buying calls. Now, all of a sudden, no one believes the market can go down, which is why we need to prepare for exactly that possibility:

Notice those red arrows don't suggest a crash. But, in each of those cases, we saw sideways consolidation or a brief correction. We could use another one right now. Also, the S&P 500's best historical period of the year - by far - has been from the October 27th close to the January 18th close. This is based on data spanning 7 decades. During this period, the S&P 500 has produced an annualized gain of 20.76%, more than twice that of the average annual return of 9% over the same 70-year period. That bullish period ended today.
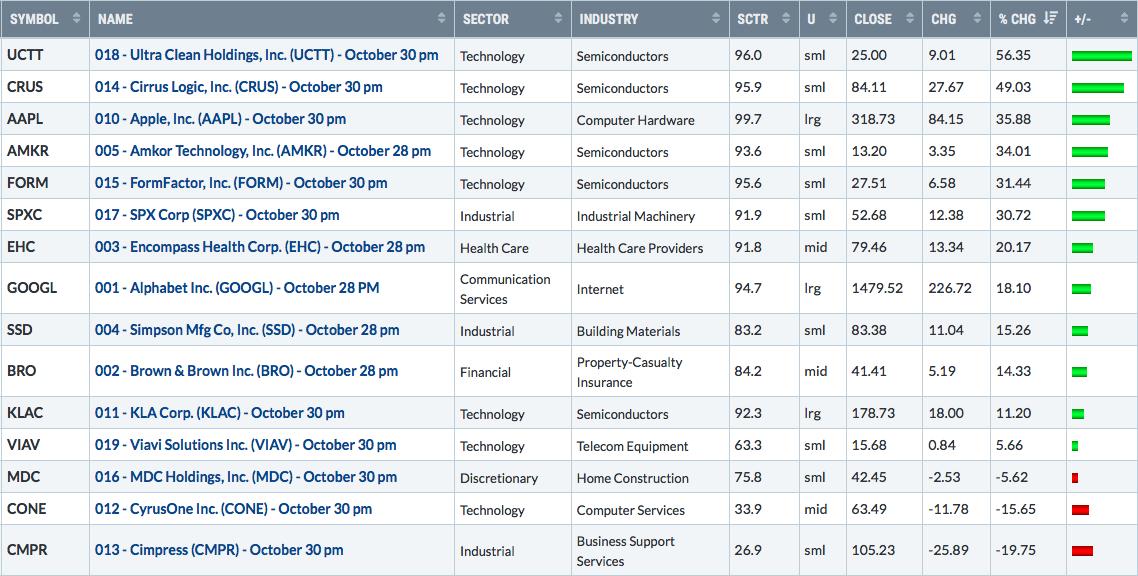
While I don't expect any kind of major selloff, a rotation most definitely could kick in. In the meantime, Wall Street is giving us a new set of leaders for the quarter ahead, if we'll only listen. Relative strength tells us who Wall Street is betting on. Three months ago, I gave EarningsBeats.com members 15 stocks before they reported their earnings. These companies looked great technically and were showing tremendous relative strength. Take a look at how these 15 companies performed over the last 90 days:

I'd say they easily outperformed the S&P 500. On Tuesday at 4:30pm EST, I'm going to give the EarningsBeats.com community a new list of 15 companies - companies that I believe are poised to deliver great quarterly earnings over the next couple of weeks. If you'd like to be part of this event, both paying subscribers of EarningsBeats and free EB Digest subscribers will be invited. Simply SIGN UP HERE and we'll send you room instructions for the event on Tuesday!
Happy trading!
Tom


