Days with wild swings, as we are seeing at the moment, are either heaven or hell, depending on what kind of trader or investor you are. Those looking for action will have a field day.
But how do you easily find tradable securities? And how do you get a handle on any potential directional moves?
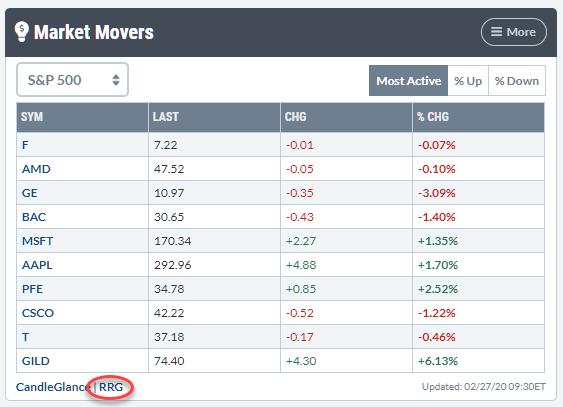
My routine on these type of days is to check my "Most Actives" widget on my dashboard. The image below shows the widget at yesterday's (2/26) close:
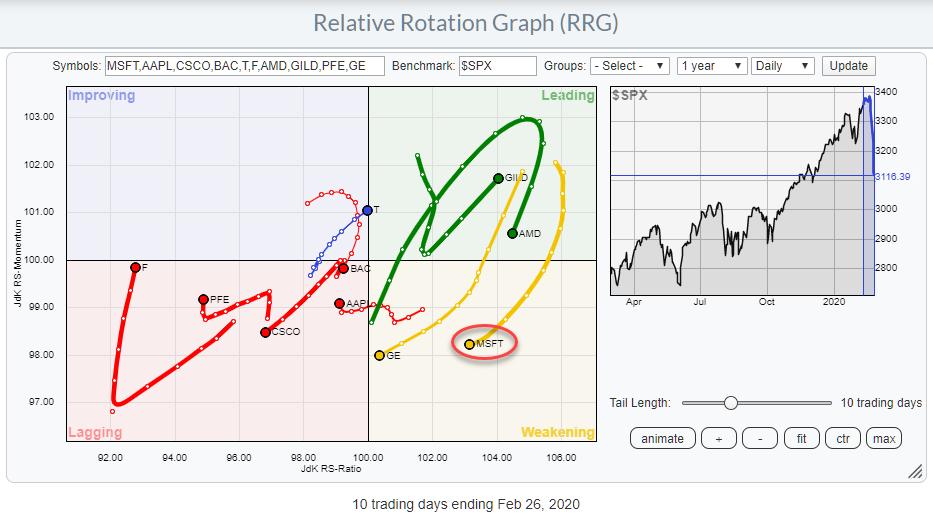
My next step is then to throw these 10 stocks on a Relative Rotation Graph against $SPX to get a quick idea on which stocks are moving in what direction. As this is geared to more shorter-term views, I use the daily version of the RRG.

That image shows some interesting tails and rotations, which help me to get a clue on where to look for opportunities - or threats.
Although I am not a news junkie (in the sense that I read three newspapers, or spend hours looking for news on the web every day), the news about a profit warning issued by Microsoft (MSFT) after yesterday's close was hard to miss.
The new "Symbol Summary" page on StockCharts.com then comes in handy, as it will give me an idea about the impact of such a message on the price of the stock.
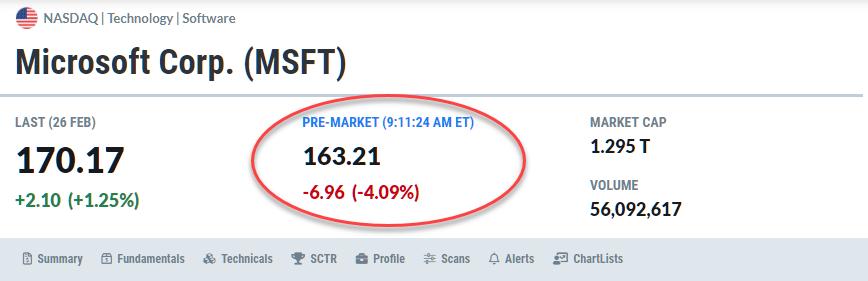
In this case, the impact is significant, with price more than 4% lower compared to the close. Hence, a lower opening, in line with the direction of the tail on MSFT, is likely.
Finally, I can check the price chart and see how this information fits in.
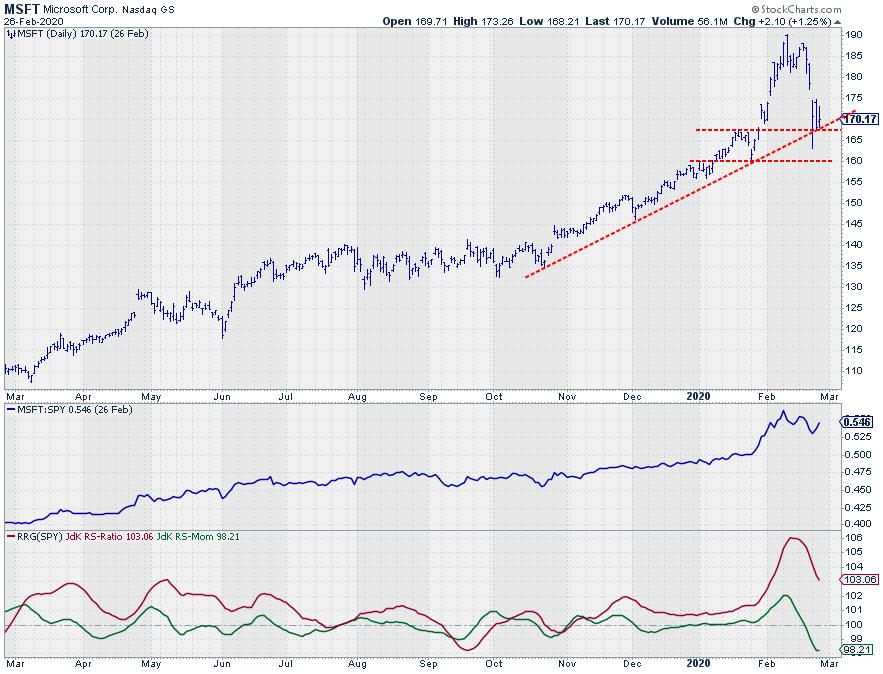
Based on the info described above, MSFT will very likely open well below the level of the rising support line, potentially testing the indicated support level around $160. Following such a move/break, the former double support around $167.50 may now be expected to start acting as resistance.
All in all, this offers short-term trading opportunities. Buying between $160-162.50 and selling near $167.50. Following the RRG-Heading on the tail of MSFT, my preferred approach would be to await any bounce upward from support before then trying to catch a lower high around $167.50 as a selling opportunity.
The ease of movement is to the downside, and a break of support at $160 will very likely cause a further acceleration lower.
-- Julius
My regular blog is the RRG Chartsblog. If you would like to receive a notification when a new article is published there, simply "Subscribe" with your email address.
Julius de Kempenaer
Senior Technical Analyst, StockCharts.com
Creator, Relative Rotation Graphs
Founder, RRG Research
Want to stay up to date with the latest market insights from Julius?
– Follow @RRGResearch on Twitter
– Like RRG Research on Facebook
– Follow RRG Research on LinkedIn
– Subscribe to the RRG Charts blog on StockCharts
Feedback, comments or questions are welcome at Juliusdk@stockcharts.com. I cannot promise to respond to each and every message, but I will certainly read them and, where reasonably possible, use the feedback and comments or answer questions.
To discuss RRG with me on S.C.A.N., tag me using the handle Julius_RRG.
RRG, Relative Rotation Graphs, JdK RS-Ratio, and JdK RS-Momentum are registered trademarks of RRG Research.
Julius de Kempenaer
Senior Technical Analyst, StockCharts.com
Creator, Relative Rotation Graphs
Founder, RRG Research
Host of: Sector Spotlight
Please find my handles for social media channels under the Bio below.
Feedback, comments or questions are welcome at Juliusdk@stockcharts.com. I cannot promise to respond to each and every message, but I will certainly read them and, where reasonably possible, use the feedback and comments or answer questions.
To discuss RRG with me on S.C.A.N., tag me using the handle Julius_RRG.
RRG, Relative Rotation Graphs, JdK RS-Ratio, and JdK RS-Momentum are registered trademarks of RRG Research.


