A lot of eye balls on the health care sector these days, and for good reasons. Traditionally, this has been one of the more defensive sectors, and it seems to be picking up that role at the moment.
On the weekly RRG for US sectors, XLF hooked sharply upward, moving rapidly back into the leading quadrant after having dropped into weakening. If you are set to approach this market from the long side, that means this is one of the sectors to go for stock picking.
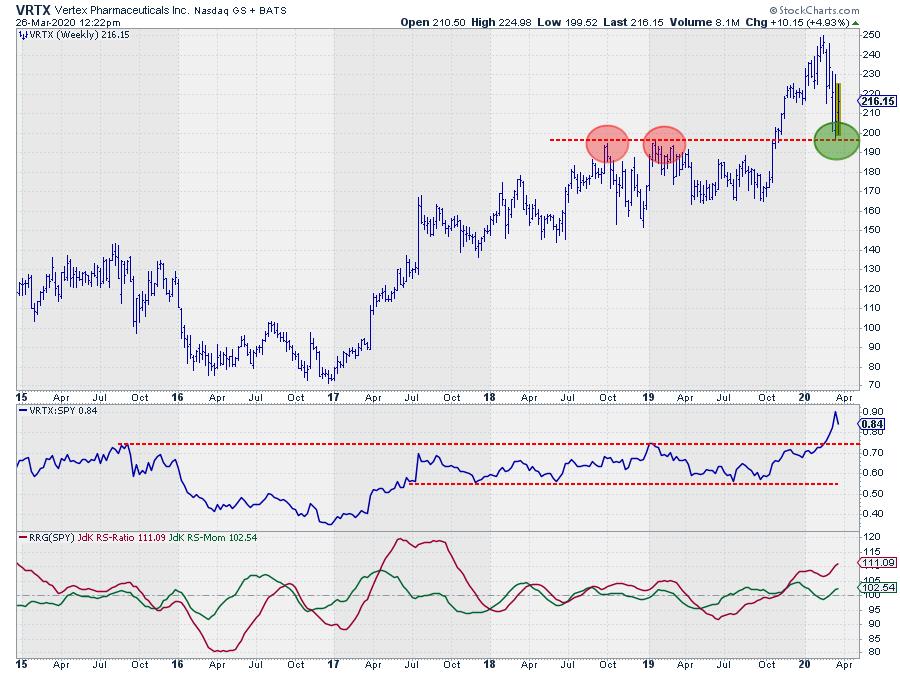
On the weekly RRG for the Health care universe, VRTX stands out with a similar hook.
Turning to the price chart of VRTX, as shown at the top of this article, reveals that the old resistance level around $195-200 has now turned into support. Since 12 March, that area has been tested numerous times on very volatile trading days, but it was never broken at a closing level.
The more this happens, the stronger the support becomes. Apparently that is an area that attracts buyers.
All in all, given the strong rotation of XLF and the strong rotation of VRTX against XLF, it looks like dips into this support range $195-200 are buying opportunities with limited risk, as stops can be put just below this support area.
Please #StaySafe.
--Julius
My regular blog is the RRG Charts blog. If you would like to receive a notification when a new article is published there, simply "Subscribe" with your email address.
Julius de Kempenaer
Senior Technical Analyst, StockCharts.com
Creator, Relative Rotation Graphs
Founder, RRG Research
Want to stay up to date with the latest market insights from Julius?
– Follow @RRGResearch on Twitter
– Like RRG Research on Facebook
– Follow RRG Research on LinkedIn
– Subscribe to the RRG Charts blog on StockCharts
– Watch Sector Spotlight
Feedback, comments or questions are welcome at Juliusdk@stockcharts.com. I cannot promise to respond to each and every message, but I will certainly read them and, where reasonably possible, use the feedback and comments or answer questions.
To discuss RRG with me on S.C.A.N., tag me using the handle Julius_RRG.
RRG, Relative Rotation Graphs, JdK RS-Ratio, and JdK RS-Momentum are registered trademarks of RRG Research.
Julius de Kempenaer
Senior Technical Analyst, StockCharts.com
Creator, Relative Rotation Graphs
Founder, RRG Research
Host of: Sector Spotlight
Please find my handles for social media channels under the Bio below.
Feedback, comments or questions are welcome at Juliusdk@stockcharts.com. I cannot promise to respond to each and every message, but I will certainly read them and, where reasonably possible, use the feedback and comments or answer questions.
To discuss RRG with me on S.C.A.N., tag me using the handle Julius_RRG.
RRG, Relative Rotation Graphs, JdK RS-Ratio, and JdK RS-Momentum are registered trademarks of RRG Research.


