Boeing (BA) had an absolutely beautiful chart that was just a nice smooth ascending line for most of the last five years. It looked like a Dreamliner flight path. With the 737 problems, a slowdown in approval of the 737 MAX changes and a stalled customer base, Boeing is facing some issues. The final part of this flight path map no longer shows a smooth descent, as Boeing's stock flight path looks more like a basketball. 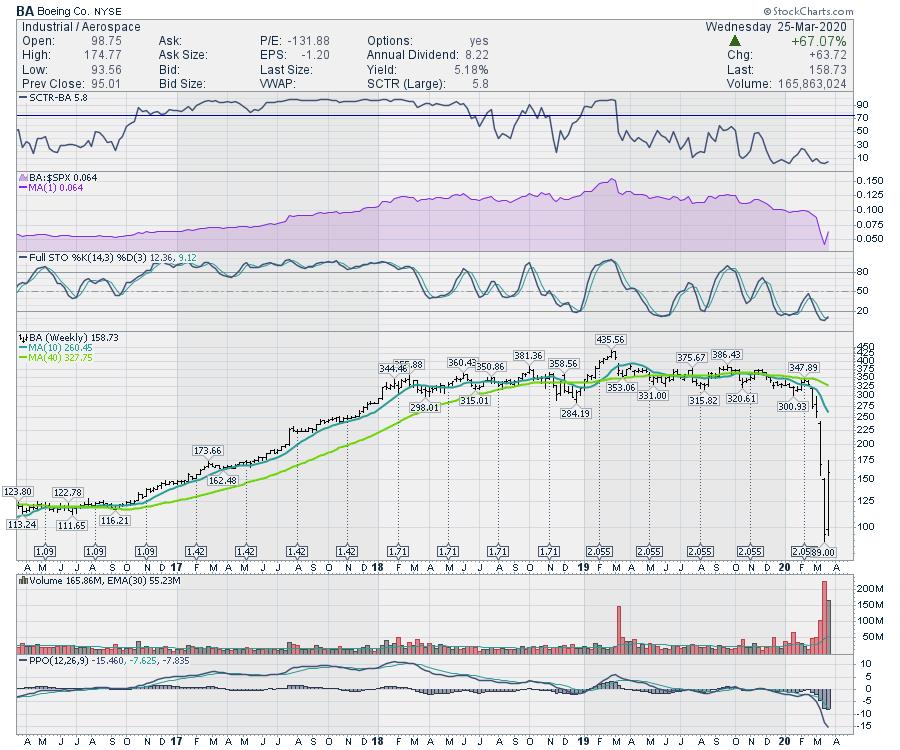
The Boeing boing was pretty significant. The basketball bounce occurred on the back of a broader market bounce, as well as a stabilization injection for Boeing from the Federal government.
Where does this go from here? The real question has to be how much more bad news needs to be built in before Boeing stabilizes. I don't believe aircraft traffic can get much weaker worldwide. The upside on the 737 MAX is some fix should be announced in 2020. The real question will be the amount of labour required to repair each existing plane. The bill for the airlines being grounded now appears to be transitioning to the Federal government, not Boeing, if they can start fixing these while they are parked anyway.
Boeing is one of the most volatile stocks in recent months. It will also be a while before they attract new investors. But it could be much like BP after the Maconda blowout, where the stock started to perform, but the ride up was not a smooth flight path.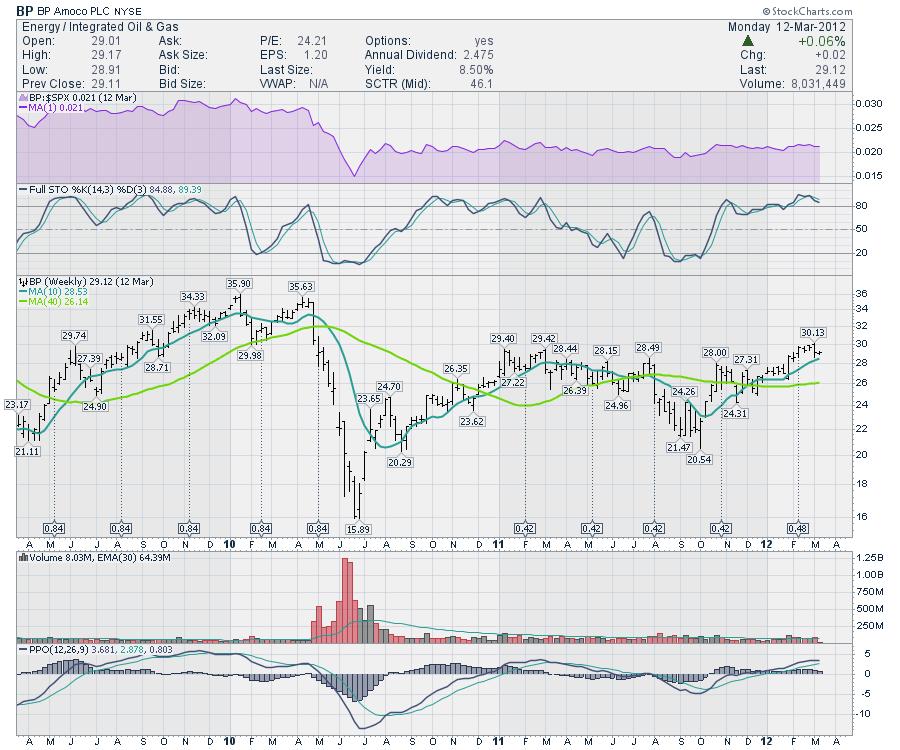
All that to say, the easy money might have already been made in Boeing, and the best entry might be on the back of the final pandemic lows. Stay safe and 6' apart!
Good trading,
Greg Schnell, CMT, MFTA
Senior Technical Analyst, StockCharts.com
Author, Stock Charts For Dummies
Want to stay on top of the market's latest intermarket signals?
– Follow @SchnellInvestor on Twitter
– Connect with Greg on LinkedIn
– Subscribe to The Canadian Technician
– Email at info@gregschnell.com


