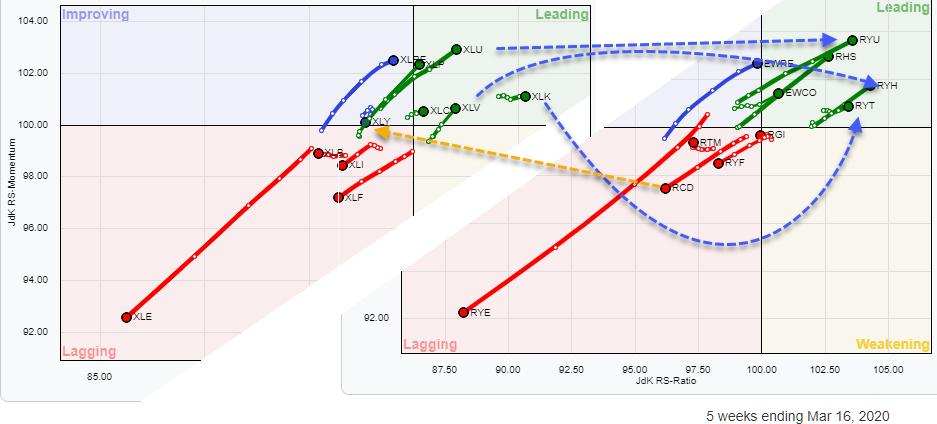
The image above shows two Relative Rotation Graphs for US sectors, side by side. The one on the left is the RRG (as I usually use it in my blogs and the Sector Spotlight show) holding 11 US sector ETFs, the SPDR ETFs offered by State Street. The one on the right also holds the 11 US sectors, but, in this case, they are the Equal Weight versions as they are offered by Invesco.
At first, the rotations and the tails on the various sectors look similar, which isn't surprising. But there are a few subtle differences.
Technology is Strong, But Not as Strong as It Looks
On the regular RRG, XLK is emerging as a defensive sector. As a matter of fact, it is the strongest sector measured on the JdK RS-Ratio scale. On the equal weight RRG, however, Utilities and Healthcare have already surpassed Technology, while Staples is rapidly catching up. All three equal weight sectors have longer tails and strong RRG-Headings, which makes them more interesting than the EW tech variant.
The fact that, on both RRGs, Technology is showing up inside the leading quadrant - and still is traveling higher on the RS-Ratio scale - ultimately still underscores the observation of Tech being/becoming a more defensive sector in this day and age.
More Pronounced Staples-Discretionary Split
On the regular RRG, the consumer sectors, staples and discretionary, have recently been traveling more closely and in sync. At the moment, XLP is accelerating from improving into leading, while XLY is stationary inside improving, at just above 100 on the JdK RS-Momentum scale, but rotating towards lagging.
On the EW RRG, Staples (RHS) is powering into the leading quadrant while Discretionary (RCD) is shooting off into lagging. Although both relationships are in favor of staples over discretionary, the EW version is more aggressive.
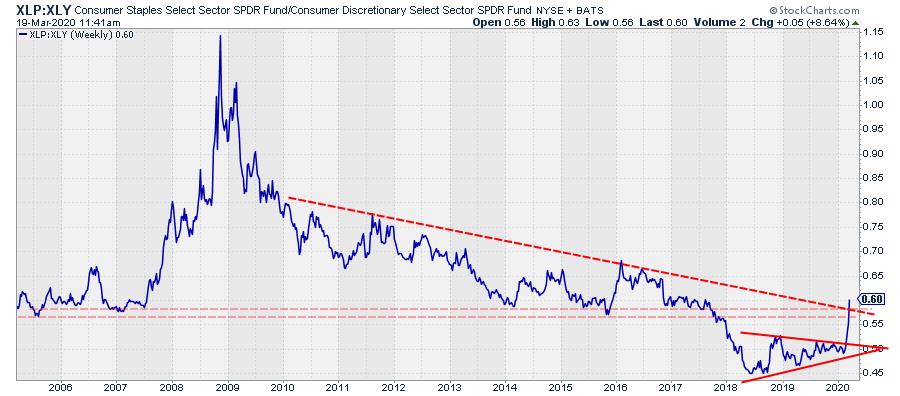
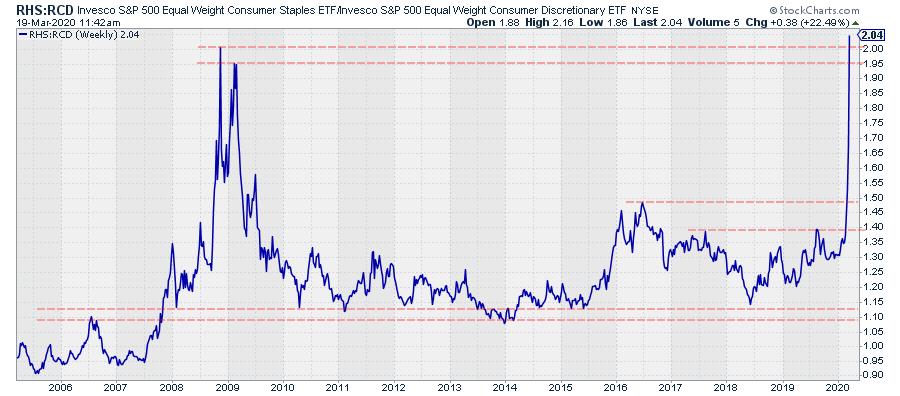
The two charts above show both relationships on a regular chart. On the upper chart, after a clear downtrend over 10+ years, XLP:XLY has completed a symmetrical triangle formation and is now breaking its long-term falling resistance line. The lower chart shows RHS:RCD, which has moved much more sideways and has now shot above the peak level that was seen back in 2008/2009.
Both ratios suggest further upside for Staples vs. Discretionary, suggesting a continued risk-off approach to the stock market.
-- Julius
My regular blog is the RRG Charts blog. If you would like to receive a notification when a new article is published there, simply "Subscribe" with your email address.
Julius de Kempenaer
Senior Technical Analyst, StockCharts.com
Creator, Relative Rotation Graphs
Founder, RRG Research
Want to stay up to date with the latest market insights from Julius?
– Follow @RRGResearch on Twitter
– Like RRG Research on Facebook
– Follow RRG Research on LinkedIn
– Subscribe to the RRG Charts blog on StockCharts
Feedback, comments or questions are welcome at Juliusdk@stockcharts.com. I cannot promise to respond to each and every message, but I will certainly read them and, where reasonably possible, use the feedback and comments or answer questions.
To discuss RRG with me on S.C.A.N., tag me using the handle Julius_RRG.
RRG, Relative Rotation Graphs, JdK RS-Ratio, and JdK RS-Momentum are registered trademarks of RRG Research.
Julius de Kempenaer
Senior Technical Analyst, StockCharts.com
Creator, Relative Rotation Graphs
Founder, RRG Research
Host of: Sector Spotlight
Please find my handles for social media channels under the Bio below.
Feedback, comments or questions are welcome at Juliusdk@stockcharts.com. I cannot promise to respond to each and every message, but I will certainly read them and, where reasonably possible, use the feedback and comments or answer questions.
To discuss RRG with me on S.C.A.N., tag me using the handle Julius_RRG.
RRG, Relative Rotation Graphs, JdK RS-Ratio, and JdK RS-Momentum are registered trademarks of RRG Research.


