Communication Services seem to be in high demand, looking at the price chart for XLC.
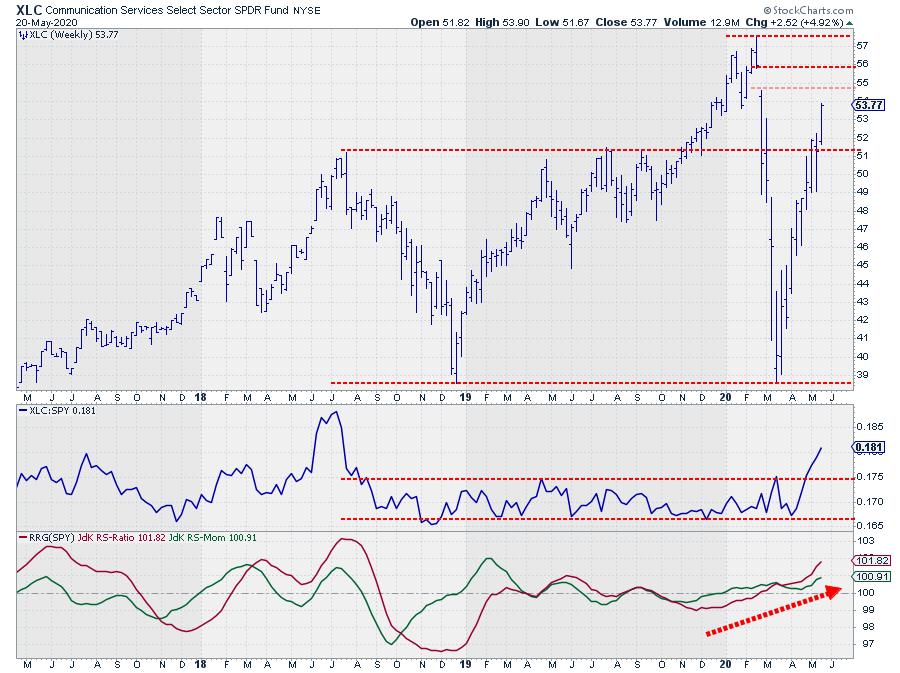
After the March crash - or was it "just a dip," with hindsight? - XLC rapidly bounced back with a vengeance. I have annotated the chart above with some horizontal support and resistance levels and want to share a few technical observations on those.
First of all, from the peak down, there's a gap area between $54.60-$55.80. In the week when that gap was formed, the horizontal then-support level near $51 was broken and the next week, despite a short peek back above $51, that break was confirmed.
The horizontal support level around $47 got slashed as if it did not even exist. Price went straight through. Both these levels have multiple historical touch-points as peaks and troughs, which means that people have been acting, buying or selling, in those areas. Not this time.
In one sharp move, price dropped to the December 2018 low at $38.53, and that's where the magic starts to happen. The December 2018 low was at $38.53 and the March low came in at $38.57. Always fascinating to see how these historical turning points come back as future support or resistance levels.
Out of that low, the sharp rally, which is still underway, started to emerge. And, pretty much just like in the decline, the barriers at $47 and $51, which were expected to act as resistance on the way up, have been non-existent. On the way down, it showed the strength of the decline, but now, on the way up, it shows the strength of the rally.
If we switch to relative strength, we see an important move during the last few weeks. Despite the big price swings both up and down in 2019, relative strength against the S&P 500 was contained within the boundaries of a trading range. That has now come to an end.
In the week starting 4 May, relative strength broke out of that range and started to rally sharply. That means that both relative strength and price are now on the rise. This strength in relative strength was picked up by the RRG-lines as early as the week starting 24 February, when XLC crossed over into the leading quadrant on the Relative Rotation Graph. The break out of the range only reinforces this up-thrust in relative strength.
For this week and the following one, I am watching resistance offered by the gap-area between and after that the high at $57.60. Given the steepness of the rally, setbacks have to be on our radar to watch. Support is expected just above $51 at that horizontal barrier. Let's wait and see if the market will respect that level when market conditions are, at least a little bit, more normal. If it does, that could be a good correction level for (re-)entry.
#StaySafe,
--Julius
My regular blog is the RRG Charts blog. If you would like to receive a notification when a new article is published there, simply "Subscribe" with your email address.
Julius de Kempenaer
Senior Technical Analyst, StockCharts.com
Creator, Relative Rotation Graphs
Founder, RRG Research
Host of: Sector Spotlight
Please find my handles for social media channels under the Bio below.
Feedback, comments or questions are welcome at Juliusdk@stockcharts.com. I cannot promise to respond to each and every message, but I will certainly read them and, where reasonably possible, use the feedback and comments or answer questions.
To discuss RRG with me on S.C.A.N., tag me using the handle Julius_RRG.
RRG, Relative Rotation Graphs, JdK RS-Ratio, and JdK RS-Momentum are registered trademarks of RRG Research.


