One of my alerts on StockCharts.com is based on the "Turtle Soup" Strategy, which was described by Larry Connors and Linda Raschke in their book Street Smarts in 1996!!
I like this setup because it looks for entries around potential tops and bottoms, and is therefore a trend-ending setup as opposed to trend-following strategies. The fact that it still works today, as it did 25 years ago, makes it a very robust setup.
Be careful it is not your "complete" trading strategy, but only an entry setup; with regard to the exit, you're on your own, which enables you to make it fit in your trading style and risk appetite.
I wrote about the setup in this old article, "Combining Relative Rotation Graphs and the Turtle Soup setup"; I have coded a scan to look for this setup on a daily basis, then combined this scan with an alert so I get a heads-up via e-mail when candidates were found.
As the strategy looks for a (re-)test of a former low, you can imagine that I do not receive many e-mails when the market is flying; they start popping in when the market starts to consolidate or correct. The ideal situation is to get alerts for individual stocks while SPY continues to rally.
Yesterday, after the close, I got this e-mail:
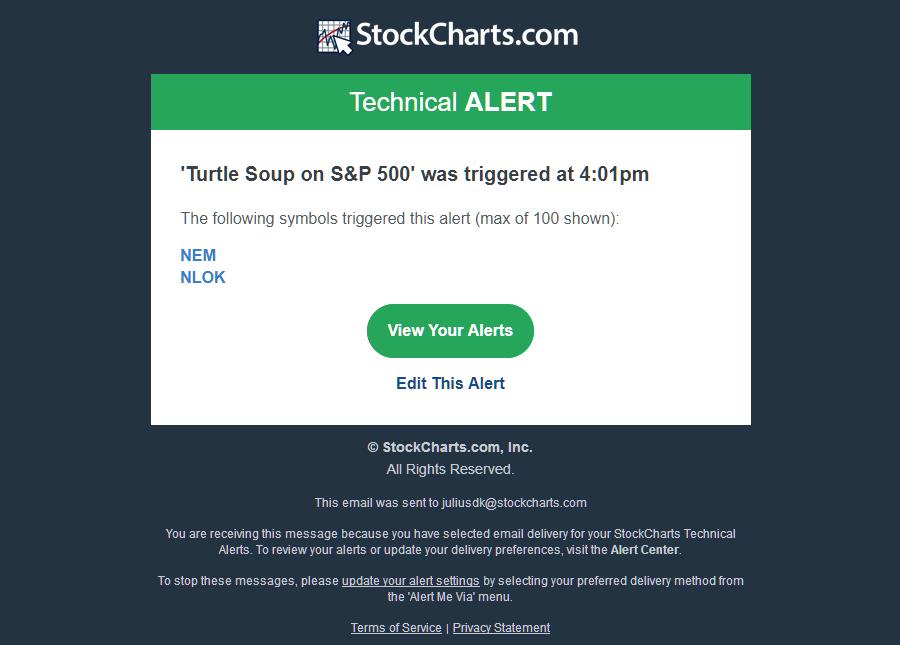
Two names ticking all the boxes for the setup. With SPY still on a roll, that's reason enough to check out these charts.
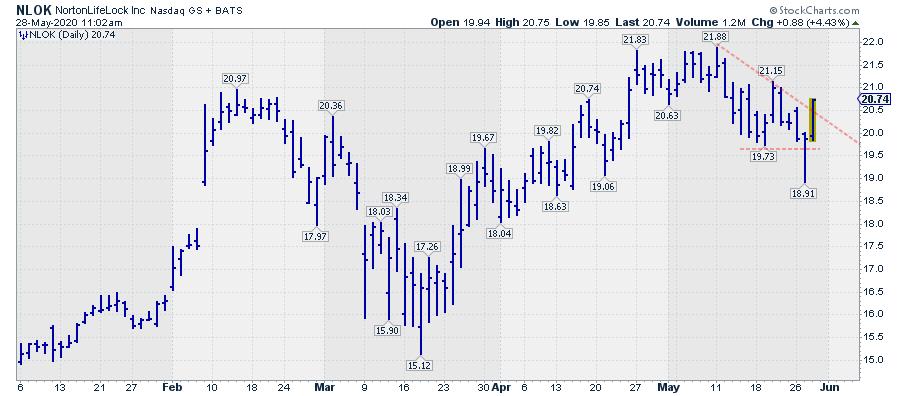
I picked NLOK (NortonLifeLock) as the chart for this article as I feel it has more strength to it than NEM (Newmont Corportation). The low of yesterday's bar, for example, tested a support area between $18.50-$19.00, and we have a nice follow-up today that seems to be breaking the declining resistance from early May.
Here is the hourly chart showing the dynamics and the setup for NLOK:
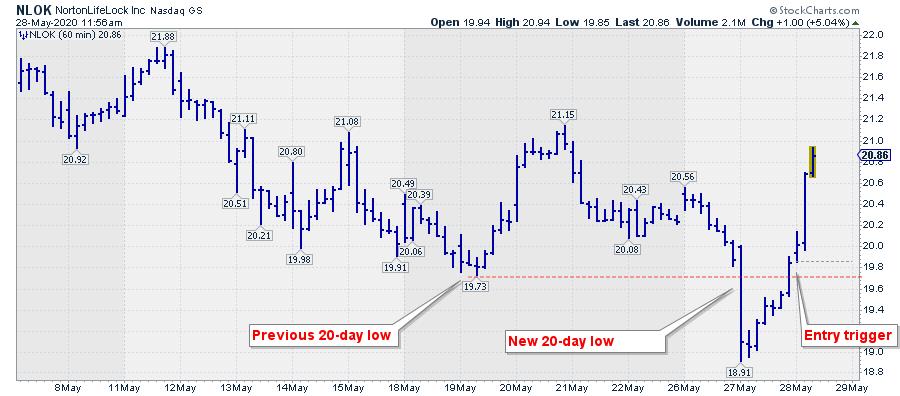
Had we followed the strategy "by the book," then the setup was triggered yesterday (5/27) at the open, when NLOK dropped below its previous 20-day low at $19.73, set on 19 May. The entry was then triggered when NLOK came back above this level. Let's say at the closing price of $19.85 with an initial stop just below yesterdays low ($ 18.91).
Obviously, that opportunity is now long gone, but I just wanted to share the anatomy of this setup with you as, imho, it is one worth keeping an eye on. And, nevertheless, despite the fact that the first part of the move may have been missed, the chart still looks to be strengthening.
The scan-code is in the linked article above and can be used to scan for intraday setups as well as EOD (like I have set up for my email alerts).
#StaySafe,
--Julius
My regular blog is the RRG Charts blog. If you would like to receive a notification when a new article is published there, simply "Subscribe" with your email address.
Julius de Kempenaer
Senior Technical Analyst, StockCharts.com
Creator, Relative Rotation Graphs
Founder, RRG Research
Host of: Sector Spotlight
Please find my handles for social media channels under the Bio below.
Feedback, comments or questions are welcome at Juliusdk@stockcharts.com. I cannot promise to respond to each and every message, but I will certainly read them and, where reasonably possible, use the feedback and comments or answer questions.
To discuss RRG with me on S.C.A.N., tag me using the handle Julius_RRG.
RRG, Relative Rotation Graphs, JdK RS-Ratio, and JdK RS-Momentum are registered trademarks of RRG Research.


