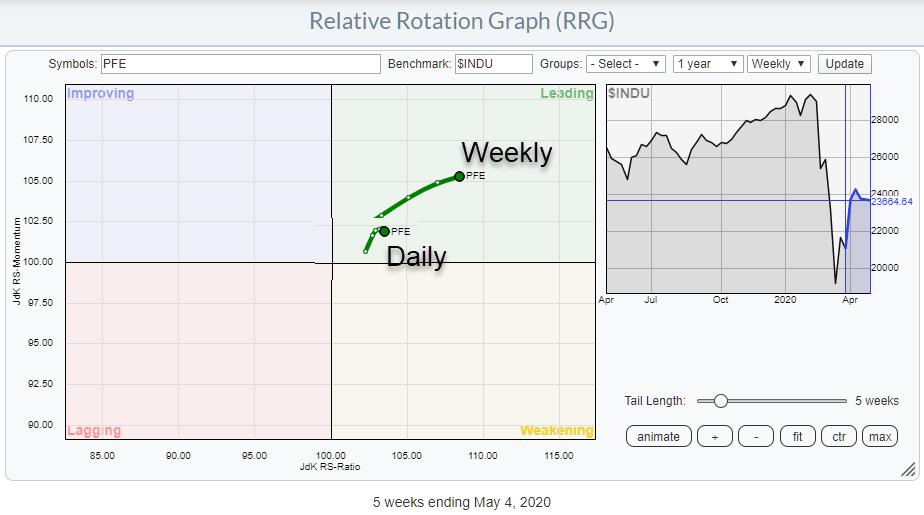
The above chart shows the daily and weekly tails for PFE overlaid on the same Relative Rotation Graph.
And before you ask... NO, you cannot do this on the site. I did need to be a little bit creative with cutting-copying-pasting-etc. But I thought it was worth it. A bit of "chart-shopping" (as opposed to photo shopping ;) ) so to say.
What it shows is that the weekly tail for PFE is well inside the leading quadrant, traveling at a strong RRG-Heading. The daily tail recently re-entered the leading quadrant after a rotation through weakening, indicating a strong relative trend that entered a new up-leg after a setback within the existing trend.
Over the last day or two, the daily tail rolled over/flattened a bit, but the weekly tail remained on course, so, for the time being, this loss of relative momentum on the daily timeframe is not alarming yet.
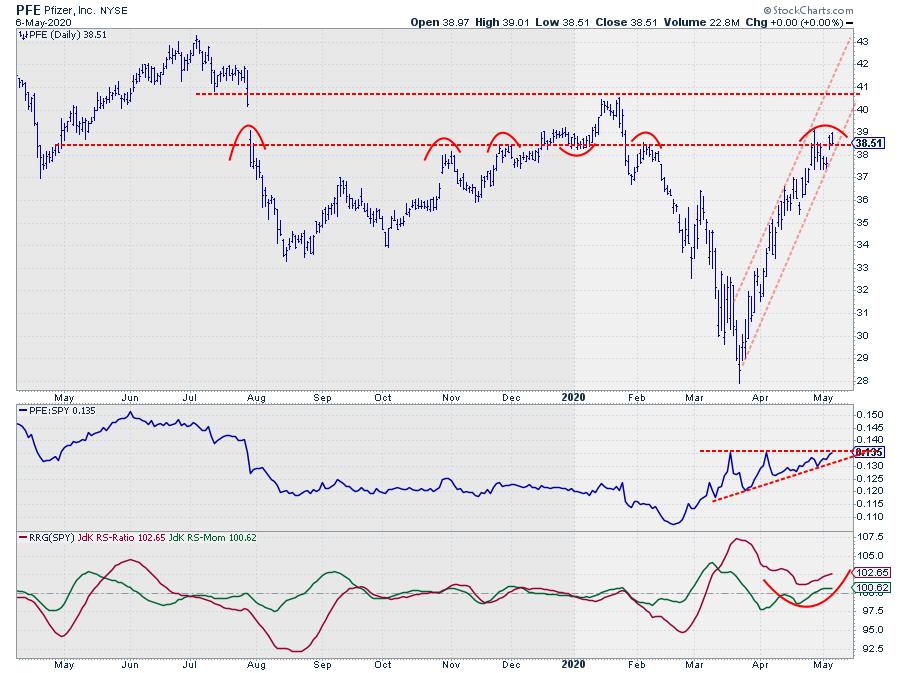
On the daily price chart with relative strength, PFE is running into a horizontal resistance barrier between $38.50-39.00, while price is still within the boundaries of the (steep) channel that emerged out of the March low. Taking out that resistance area, the next hurdle just below $41 will add fuel to the rally that is underway.
From a relative perspective, the developing ascending triangle is the reason for the recent leveling off in relative momentum. A break above that horizontal resistance in relative momentum will put the daily RRG-tail back on track for a further rotation into the leading quadrant.
All in all, the improvement in both price and relative strength and the push against resistance on both charts make PFE worth keeping an eye on!
#StaySafe,
--Julius
My regular blog is the RRG Charts blog. If you would like to receive a notification when a new article is published there, simply "Subscribe" with your email address.
Julius de Kempenaer
Senior Technical Analyst, StockCharts.com
Creator, Relative Rotation Graphs
Founder, RRG Research
Host of: Sector Spotlight
Please find my handles for social media channels under the Bio below.
Feedback, comments or questions are welcome at Juliusdk@stockcharts.com. I cannot promise to respond to each and every message, but I will certainly read them and, where reasonably possible, use the feedback and comments or answer questions.
To discuss RRG with me on S.C.A.N., tag me using the handle Julius_RRG.
RRG, Relative Rotation Graphs, JdK RS-Ratio, and JdK RS-Momentum are registered trademarks of RRG Research.


