Inside the Health Care sector, IDXX is one of the stocks that stands out in a positive way.
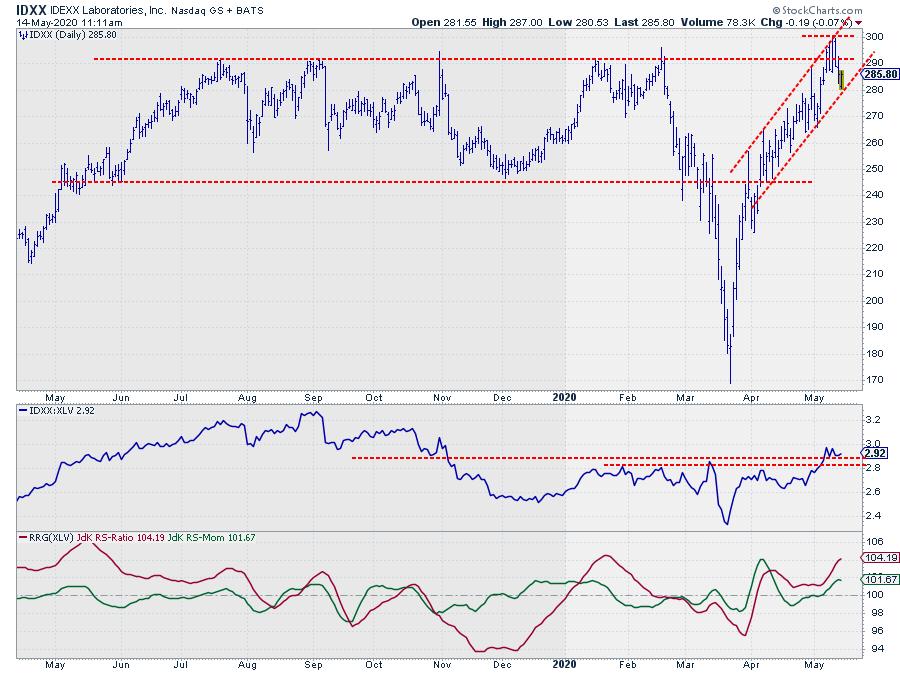
Since mid-2019, IDXX has been bouncing against resistance around $290, but never managed to get to a clear break. The peak that was set in the week beginning 2/19 was the last attempt before markets started to slide.
In the process, IDXX broke resistance at $270, and, just for the record, NO that was NOT a double top!! Shortly thereafter, the stock broke the lower boundary of the range in which it had traded since May 2019.
The acceleration following that break led to a low near $170, which is very close to the December 2018 low and a cluster of highs that were formed in 2017. That makes $170 an important area in terms of support and resistance.
Going into the decline, relative strength was not particularly strong. The RS-line picked up some upward movement since late 2019, but more or less moved sideways in 2020 until March, when the line sharply dipped.
The recovery out of that March (relative) low was a sign of further improvement. After an initial recovery, relative strength went sideways in April and started to pick up again in May; it now seems to be breaking above the highs that we saw earlier this year.
This improvement is causing the RRG-Lines to start rising again above the 100-level, which puts IDXX inside the leading quadrant at a positive RRG-heading.
The price chart is showing a similar sharp recovery, which first brought IDXX back into its trading range before a stable channel started to develop; that channel has now been in play for about six weeks.
A few days ago, IDXX managed to peek above the overhead resistance barrier and peak at $300, but then fell back below that level. The low for today so far seems to have tested the rising support line, out of which a new up-leg is emerging.
If IDXX can hold up this strength and get back above $290 (and preferably $300) while keeping upward momentum in relative strength, IDXX will continue to be an outperformer in the Healthcare sector.
A basic price target calculation would be to project the height of the range ($45) above the breakout level ($290) which points to $335. The presence of a major resistance/support level and a rising support line offers good levels for setting a set stop-loss close to a possible entry point, providing a solid risk/reward opportunity.
#StaySafe,
--Julius
My regular blog is the RRG Charts blog. If you would like to receive a notification when a new article is published there, simply "Subscribe" with your email address.
Julius de Kempenaer
Senior Technical Analyst, StockCharts.com
Creator, Relative Rotation Graphs
Founder, RRG Research
Host of: Sector Spotlight
Please find my handles for social media channels under the Bio below.
Feedback, comments or questions are welcome at Juliusdk@stockcharts.com. I cannot promise to respond to each and every message, but I will certainly read them and, where reasonably possible, use the feedback and comments or answer questions.
To discuss RRG with me on S.C.A.N., tag me using the handle Julius_RRG.
RRG, Relative Rotation Graphs, JdK RS-Ratio, and JdK RS-Momentum are registered trademarks of RRG Research.


