I got triggered to watch the chart printed above when I was scrolling through the pre-defined RRG groups.
This is a routine I go through on a regular basis; just flip through all pre-defined RRGs and see if I note any strange or particularly strong or weak rotations. Literally right as I loaded the last RRG in the drop down box, I saw the RRG below.
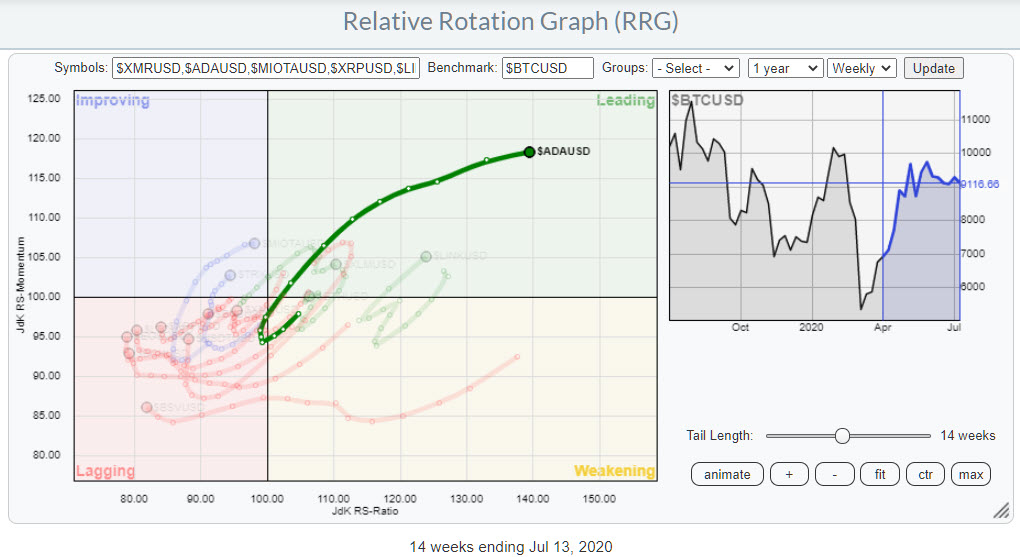
This is a universe of cryptocurrencies while using Bitcoin ($BTCUSD) as the base for the universe. The tail for $ADAUSD immediately caught my attention as it is powering into the leading quadrant, far away from the other cryptos in this universe. As I am by no means a crypto expert I looked up what kind of coin ADA represents. It is called Cardano.
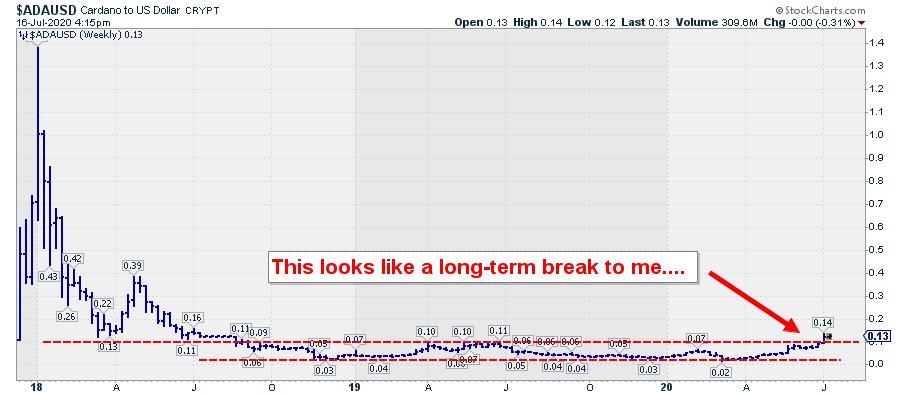
But from a technical (trading) perspective, that is "nice-to-know" information. What I really liked when I opened up the weekly chart for $ADAUSD was the breakout that seems to be unfolding right at this moment from a two-year base. As you know, such long-term breakouts are rare, but when they do occur they usually lead to significant price moves.
Like so many of these cryptocurrencies, Cardana jumped to a high of $1.40 shortly after the introduction, then faded away to levels around $0.11-0.13, followed by a hiccup to $0.39 in April 2018 and then breaking below $0.11 in August.
Once below $0.11, $ADAUSD started trading in a range between roughly $0.03 and $ 0.11 for about two years... until a week ago when it cleared the upper boundary of that range.
I know, the range of the movements in these Crypto Coins is unbelievable; the distance from low to high INside that range was around 350%. The move from the High at $1.40 to the Low, say, $0.03 is 98%. So trading this is not for the faint of heart, but it can be a nice play on the side.
If I just apply some basic TA to the chart of $ADAUSD, I would project the height of the range ,which is $0.07-0.08, to the breakout level, let's say $0.11. That gives a price target around $0.18-0.19, which is roughly 70% upside...
And looking at the chart I can also make a case for the next major resistance level to come in around $ 0.39.
And you know what...? Such moves are totally possible in Crypto Space.
#StaySafe, --Julius
My regular blog is the RRG Charts blog. If you would like to receive a notification when a new article is published there, simply "Subscribe" with your email address.
Julius de Kempenaer
Senior Technical Analyst, StockCharts.com
Creator, Relative Rotation Graphs
Founder, RRG Research
Host of: Sector Spotlight
Please find my handles for social media channels under the Bio below.
Feedback, comments or questions are welcome at Juliusdk@stockcharts.com. I cannot promise to respond to each and every message, but I will certainly read them and, where reasonably possible, use the feedback and comments or answer questions.
To discuss RRG with me on S.C.A.N., tag me using the handle Julius_RRG.
RRG, Relative Rotation Graphs, JdK RS-Ratio, and JdK RS-Momentum are registered trademarks of RRG Research.


