Last week's selloff primarily hit some mega-cap names in Technology, Communication Services and Discretionary stocks. For sure, it shook up markets pretty well and, as usual, the selling of risk assets led to an inflow into risk-off assets like bonds and more defensive sectors.
Another ways of breaking down the US stock universe is by slicing and dicing it into groups based on market capitalization; Large-, Mid- and Small-Caps. Another popular division is Value versus Growth. These two breakdowns can then be combined into, for example, Large-Cap Growth, Small-Cap Value, Mid-Cap Value,... etc.
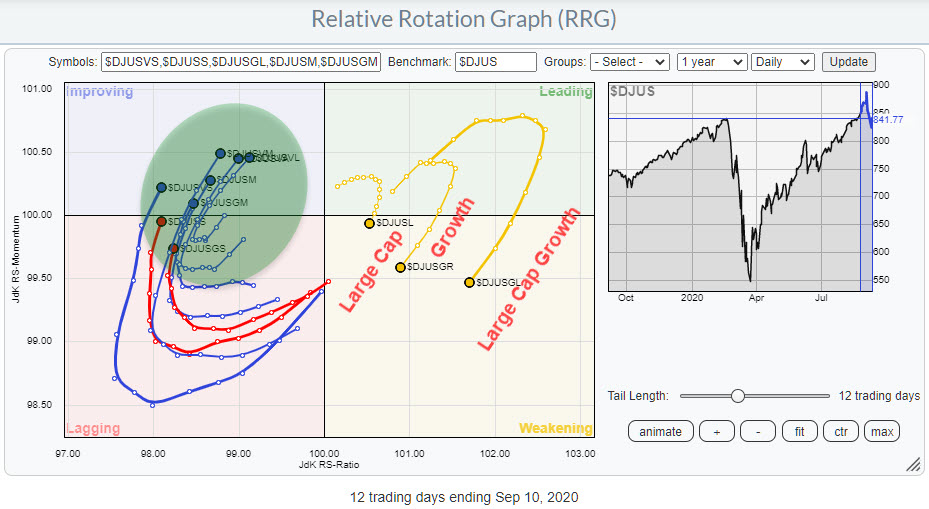
The Relative Rotation Graph above uses this combined breakdown and enables the visualization of the various segments of the US stock market, sliced by value vs growth on the one hand, along with the three market-cap based groups on the other.
Together, this makes a universe of 11 indexes, which are shown in the RRG above. Clicking the image will open up a live version of the chart, which is also available as an option in the drop-down box on the RRG page.
What we see here is that during the sell-off , the three groups that are now inside the weakening quadrant got hit hardest on a relative basis. These are Large Caps, which is all large-cap stocks value and growth combined. Then Growth, which is all Growth stocks, so large-, mid- and small-cap combined. And finally there's Large-Cap Growth, which is the combination of the two.
As you can see from the tail, this last group shows the widest rotation, which means that it went up further than the others but what goes up... must .... ;) harder than others ...
The RRG shows that money has been and still is rotating out of these groups, as the tails are pointing at an RRG-Heading between 180-270 degrees. So where is all that money that is taken out of these groups going to?
Pretty much all other groups in this universe are led by value stocks for the time being. How long this rotation will last we will have to wait and see, but for now the rotation is pretty clear.
I know there are a lot of bearish calls out there, and probably for good reasons and I can relate to a lot of the arguments.
But, thinking outside the box and off the beaten path, I could argue that the rotation out of mega-large-cap growth stocks into mid- and small-cap growth AND value stocks makes the participation in the current rally/uptrend broader-based. Which should be good for the market as a whole.
We'll stay alert, and maybe it's wrong, but I am keeping an open mind and seeing this as a possible scenario for coming weeks.
#StaySafe, --Julius
My regular blog is the RRG Charts blog. If you would like to receive a notification when a new article is published there, simply "Subscribe" with your email address.
Julius de Kempenaer
Senior Technical Analyst, StockCharts.com
Creator, Relative Rotation Graphs
Founder, RRG Research
Host of: Sector Spotlight
Please find my handles for social media channels under the Bio below.
Feedback, comments or questions are welcome at Juliusdk@stockcharts.com. I cannot promise to respond to each and every message, but I will certainly read them and, where reasonably possible, use the feedback and comments or answer questions.
To discuss RRG with me on S.C.A.N., tag me using the handle Julius_RRG.
RRG, Relative Rotation Graphs, JdK RS-Ratio, and JdK RS-Momentum are registered trademarks of RRG Research.


