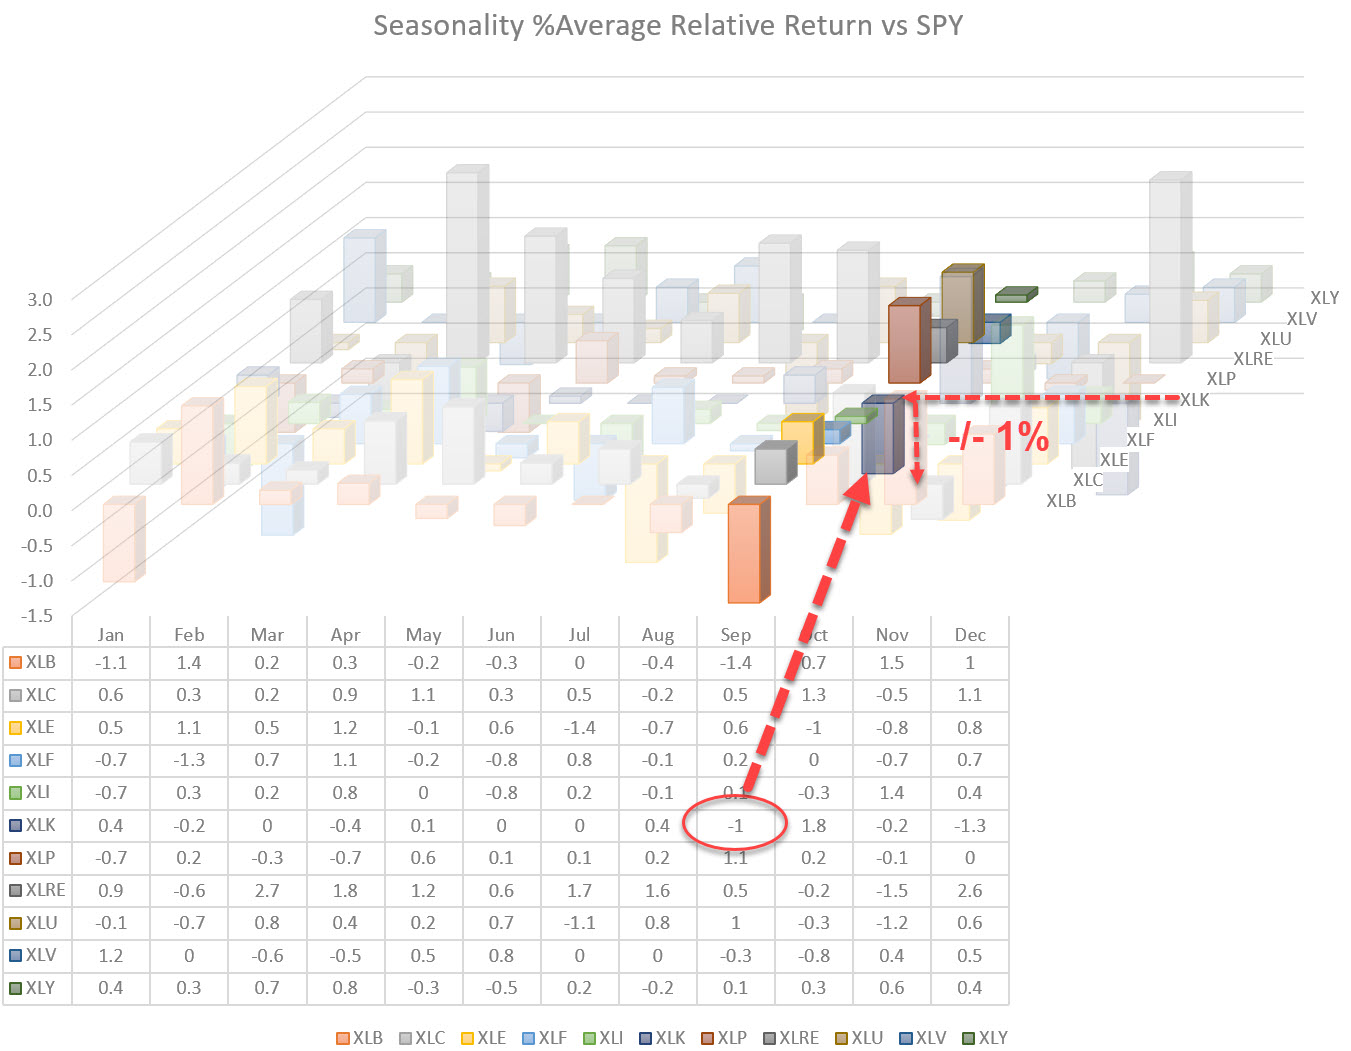
Last Tuesday in Sector Spotlight, as well as in my last article of the RRG blog, I discussed seasonality for US sectors. While going over the table showing the average returns per sector per month, my eye fell on another number... the minus-one percent (-1%) for the Technology sector. This is interesting as the seasonal over-/under-performance shows 45%, which means that technology has outperformed SPY only 45% of the time in the past.
Usually, I do not pay too much attention to seasonality figures between 40-60 as they are too much of a coin toss. But the combination of 45% outperformance and a minus 1% historical underperformance for the month is noteworthy.
Despite the fact that the percentage of time XLK outperformed SPY is only 45%, we have to conclude that during the 55% of the time when XLK is UNDERperforming SPY, the amount of underperformance is significant because the -1% is the combined result of ALL history, not just the months of underperformance.
The image below shows the image with the seasonality for SPY over the last 20 years.
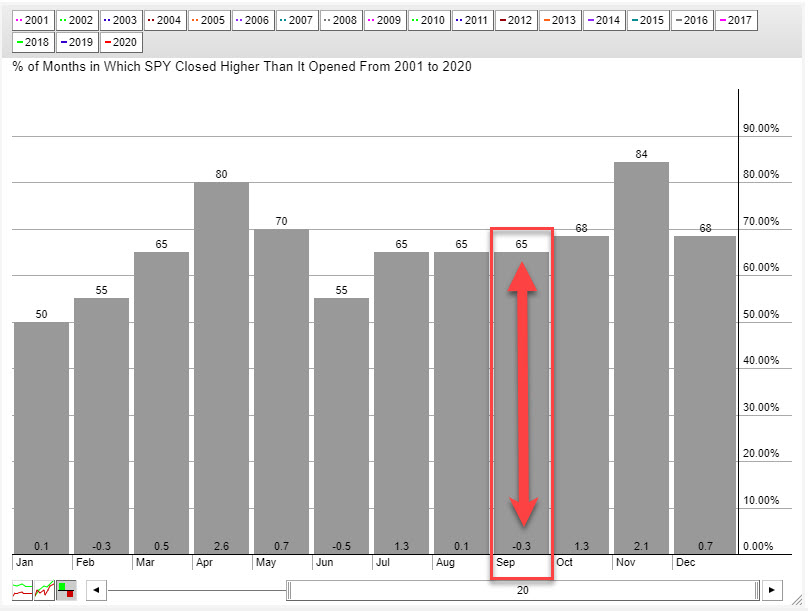
This is also an interesting image.
65% of the time, SPY closed higher in the month of September. HOWEVER... the average return for September is Minus 0.3% (-0.3%). So when SPY goes down during September, it goes down (much) more than the times when it goes up.
So, all in all, we have a situation where September is not a particularly good month for SPY, nor for Technology (XLK). But it's not particularly bad either. The average returns, however, for both SPY and XLK are negative.
The image below shows the daily RRG for US sectors:
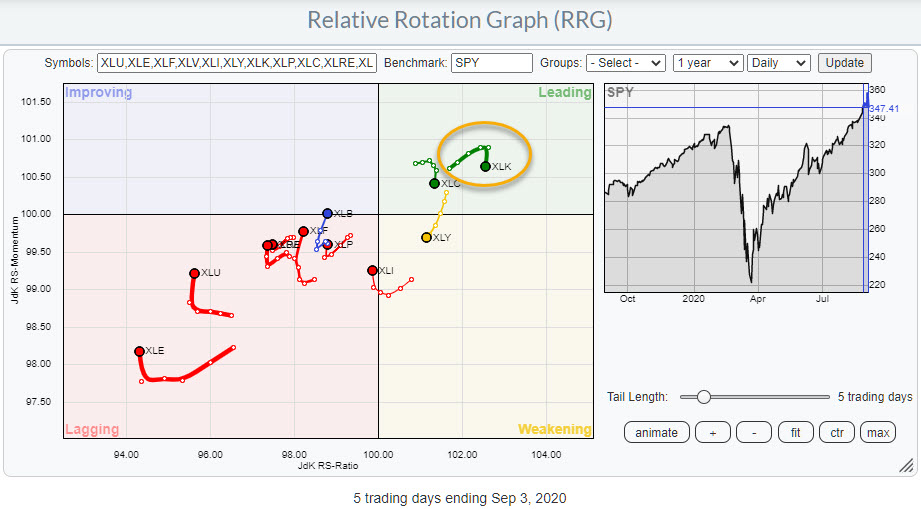
What we see here is that the tail on XLK has started to roll over today. This snapshot was taken around noon, with XLK down around 5%.
If this is the prelude to a weak month for both SPY and XLK, we could be in for a bit of a ride in coming weeks.
The good news is that seasonality for October shows strong improvement for both SPY and XLK, with an expected return of +1.8% for technology and 1.3% for SPY - as well as, 68% of the time, an outperformance for XLK over SPY.
My regular blog is the RRG Charts blog. If you would like to receive a notification when a new article is published there, simply "Subscribe" with your email address.
Julius de Kempenaer
Senior Technical Analyst, StockCharts.com
Creator, Relative Rotation Graphs
Founder, RRG Research
Host of: Sector Spotlight
Please find my handles for social media channels under the Bio below.
Feedback, comments or questions are welcome at Juliusdk@stockcharts.com. I cannot promise to respond to each and every message, but I will certainly read them and, where reasonably possible, use the feedback and comments or answer questions.
To discuss RRG with me on S.C.A.N., tag me using the handle Julius_RRG.
RRG, Relative Rotation Graphs, JdK RS-Ratio, and JdK RS-Momentum are registered trademarks of RRG Research.


