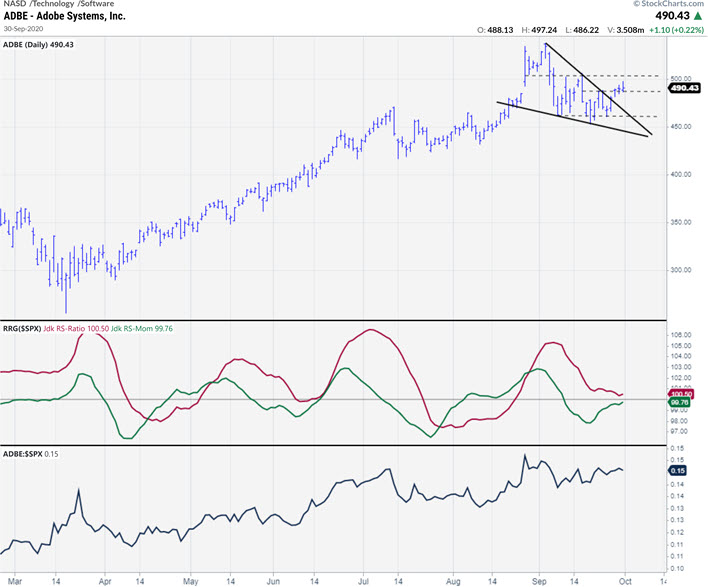
The chart above shows the daily price bars for ADBE, in combination with the RRG-Lines and raw Relative Strength.
There are two reasons to use this chart today. The first is to make sure all of you are aware of the rapid further development of the new ACP platform here on StockCharts.com. The improvements keep coming and I thought it would only make sense to start using ACP charts in blog articles.
Click on the image and the live version of that chart will open inside ACP.
(To be sure, I will continue to use the good old Sharpcharts because... well, because they simply work and do what they have to do and are very easy to use in articles.)
The second reason is because I found that ADBE is showing interesting rotations on both the weekly and the daily Relative Rotation Graph.
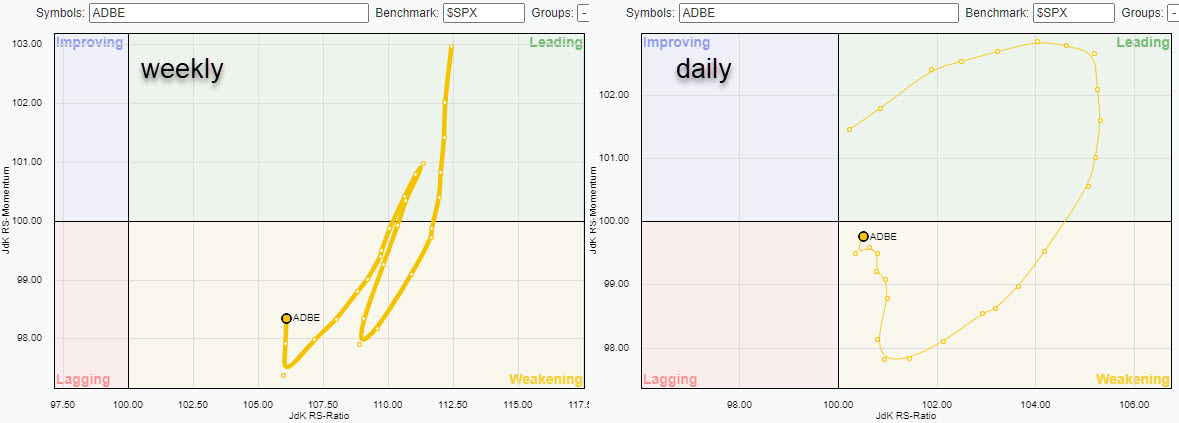
This image shows the weekly rotation on the left and the daily rotation on the right. Both tails are inside the weakening quadrant, but recently started curling back up again. This is often a strong sign, especially when both time frames are confirming each other.
From a relative point of view, this makes ADBE an interesting stock to watch. The fact that it is inside the technology sector, which itself is also strengthening again vs the S&P 500, makes it even more interesting.
The daily chart at the top of the article shows the daily bar chart where a falling wedge (=bullish) has just completed and triggered a signal to continue the previous upward trend.
There is some intermediate resistance to overcome around $505. The big hurdle will be the all-time high at $537. Once that can be cleared, much more upside potential for ADBE will be unlocked.
#StaySafe, --Julius
My regular blog is the RRG Charts blog. If you would like to receive a notification when a new article is published there, simply "Subscribe" with your email address.
Julius de Kempenaer
Senior Technical Analyst, StockCharts.com
Creator, Relative Rotation Graphs
Founder, RRG Research
Host of: Sector Spotlight
Please find my handles for social media channels under the Bio below.
Feedback, comments or questions are welcome at Juliusdk@stockcharts.com. I cannot promise to respond to each and every message, but I will certainly read them and, where reasonably possible, use the feedback and comments or answer questions.
To discuss RRG with me on S.C.A.N., tag me using the handle Julius_RRG.
RRG, Relative Rotation Graphs, JdK RS-Ratio, and JdK RS-Momentum are registered trademarks of RRG Research.


