While going over some Relative Rotation Graphs showing the rotations for individual stocks, the tail for AMD in the Technology sector caught my attention.

AMD was one of the leading tech stocks from July to early September, almost doubling in price, but then started to fade in terms of relative strength.
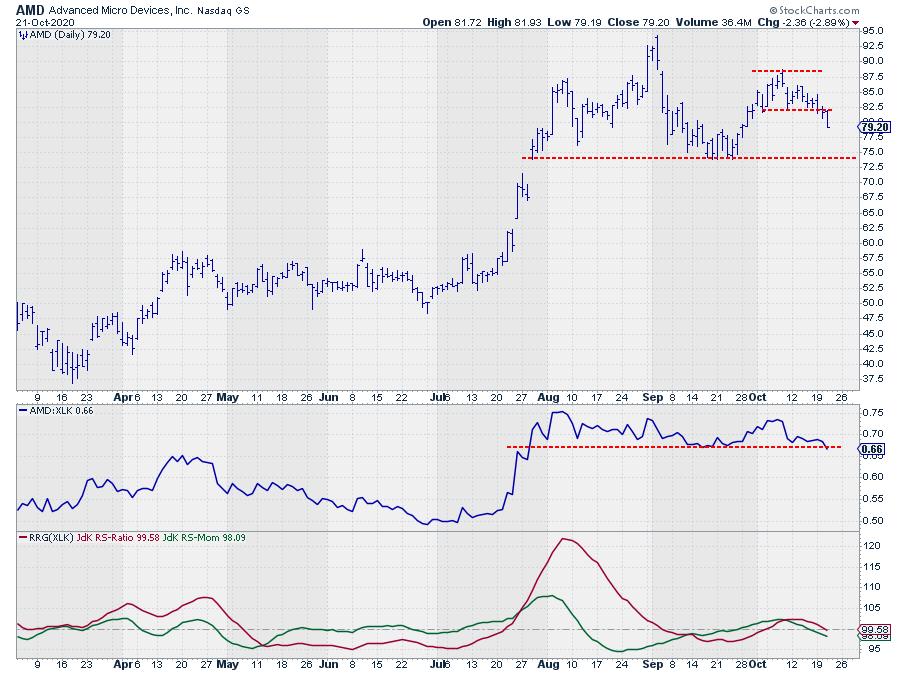
This has led to an RS-line that has moved more or less sideways from mid-August onward. It is now testing support and threatening to break lower in relative terms. On the daily RRG, this has already led to the tail crossing over into the lagging quadrant. On the weekly RRG, the tail rolled over inside leading 4-5 weeks back from very high levels and is now moving into the weakening quadrant.
The reason for marking AMD as being "at risk" is the fact that both the weekly and the daily price charts are not very supportive anymore for a continued rally.
On the weekly chart, the latest rally was not able to reach its previous high and the formation that is currently playing out could well turn out to be a double top, with the pivotal support level just below $74. The daily chart at the top of the article shows this in more detail, and it can be seen that the recent peak on the weekly chart is already turning out to be the start of a new series of lower highs and lower lows on the daily version.
Breaking below the September lows is expected to cause an acceleration lower in price for AMD, which will certainly cause more weakness in relative strength versus XLK!!
#StaySafe, --Julius
My regular blog is the RRG Charts blog. If you would like to receive a notification when a new article is published there, simply "Subscribe" with your email address.
Julius de Kempenaer
Senior Technical Analyst, StockCharts.com
Creator, Relative Rotation Graphs
Founder, RRG Research
Host of: Sector Spotlight
Please find my handles for social media channels under the Bio below.
Feedback, comments or questions are welcome at Juliusdk@stockcharts.com. I cannot promise to respond to each and every message, but I will certainly read them and, where reasonably possible, use the feedback and comments or answer questions.
To discuss RRG with me on S.C.A.N., tag me using the handle Julius_RRG.
RRG, Relative Rotation Graphs, JdK RS-Ratio, and JdK RS-Momentum are registered trademarks of RRG Research.


