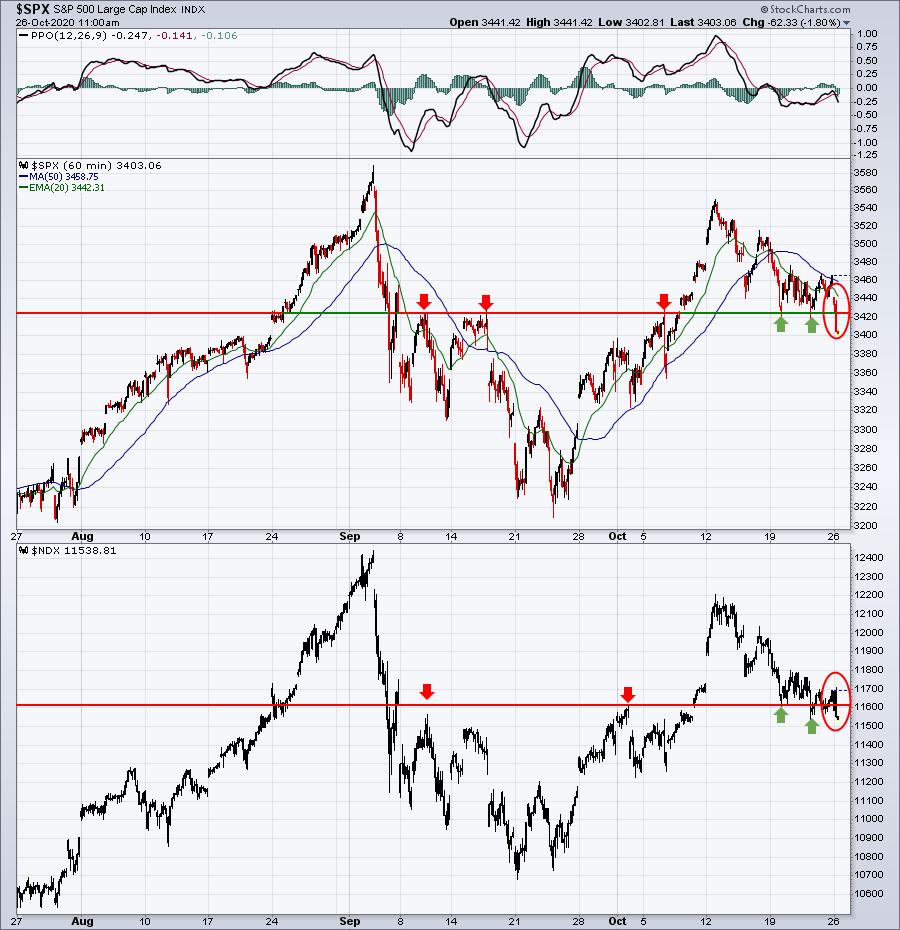
I expect that we'll bounce sooner rather than later, but a key short-term test is underway right now. I'm watching 3425 on the S&P 500 ($SPX) and 11600 on the NASDAQ 100 ($NDX). Both support levels are currently lost. A weak finish today would set up for additional short-term selling, while a reversal this afternoon would encourage more buyers:
We have two days left (today and tomorrow) of the worst historical week of the year. After that ends, we begin the most bullish 9 day stretch of the year - again, historically. History doesn't provide us any guarantee of future price action, but I believe it's very worthwhile to at least be aware of stock market history, especially if technical conditions begin to align with those historical tendencies. That's one reason why I'm watching action in the near-term quite closely.
Please consider joining me at EarningsBeats.com for a free EB Digest newsletter subscription. I publish it 3x per week on Mondays, Wednesdays and Fridays, and there's no credit card required to subscribe. It's completely, 100% free. CLICK HERE to start your free subscription today!
Tom Bowley, Chief Market Strategist, EarningsBeats.com
