With Bitcoin up around 10% and breaking beyond $20k, there can only be one chart today that should not be ignored.
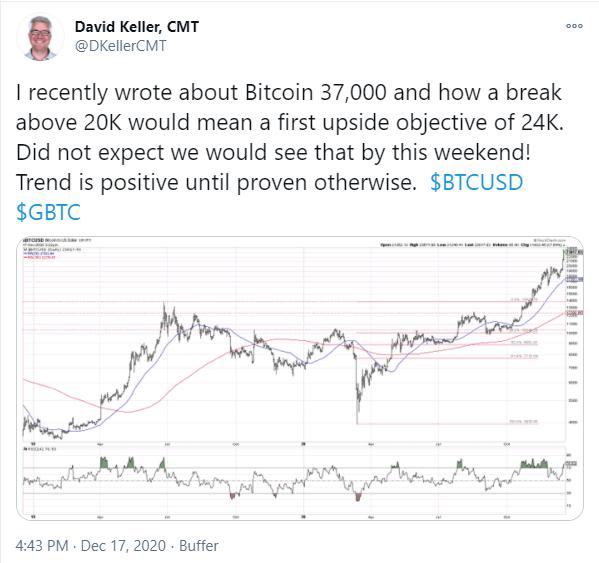 BTC moved back to the forefront of financial markets and press recently. Dave Keller recently wrote about it and sent out this tweet (to the right) today. And I myself am guilty of that too with my last article in the Chartwatchers Newsletter: "(When) Will we see $40k in Bitcoin?"
As $BTC moved past the $20k barrier today, that surely is a major milestone for the digital currency itself, but also for cryptocurrencies as a group.
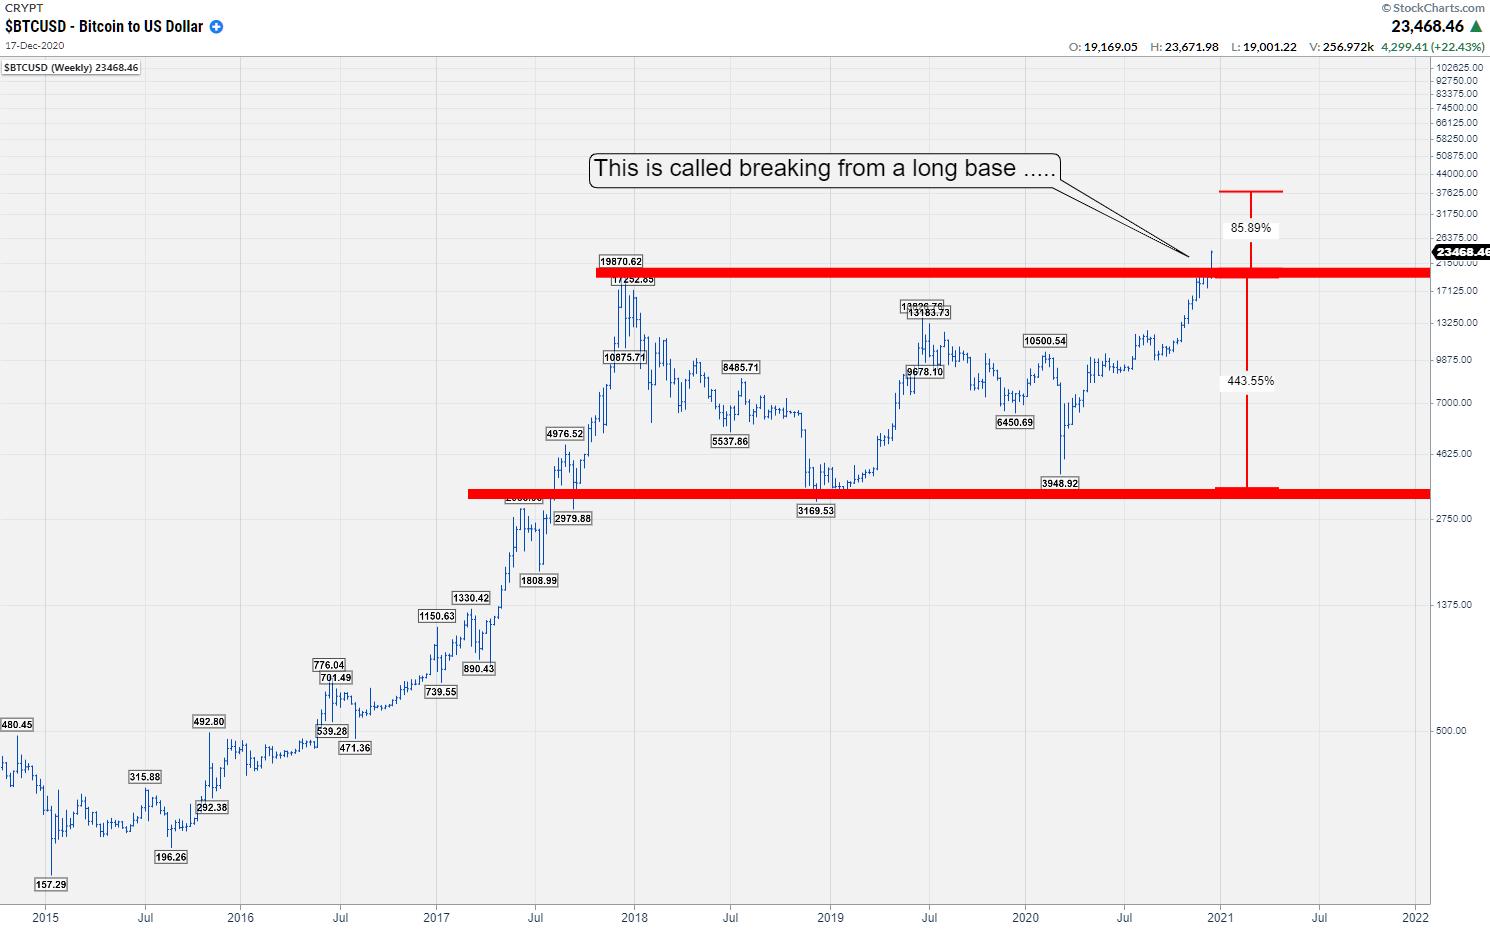
The chart above shows the long term price history for $BTC vs $USD. In December 2017, Bitcoin reached its high at about $19.900 (rounded number and, depending on what exchange you are looking at, there may be slight differences). With the end of the hype, media got quiet and investors turned away or HODL'd (Hold On for Dear Life...).
All of a sudden, here we are three years later, almost to the day, with Bitcoin again all over the news as price first approaches the $20k barrier and, as of today, breaks it.
$BTC arrived in the $19.500-20.000 area late November, and touched the $ 19.900 mark on 1st of December. So the market was hit with overhead supply for about three weeks since late November. Most likely, this supply came from people that bought at or very near to the $20k peak in 2017 and saw this as the perfect opportunity to unload that position without a loss, giving a sigh of relief. Also likely is that there have also been people who started selling $BTC short through futures, options or other types of derivatives, speculating on a new decline off of that high mark.
That lasted for three weeks, and now the people who sold their holdings are watching the market run and may want to get back in as "they were finally right after all." The short-sellers are feeling the pain and, for some, that may already be too much to bear and they need to cover (= buying $BTC) and, if they want to reverse, they need to buy twice the amount. And then there will very likely be a new group of investors/traders that want to onboard this new trend.
All in all, plenty of demand which is meeting very little supply for the time being.
From a purely technical point of view, $BTC is breaking away from a big base that was built from 2017 to the present. As a rule, "the bigger the base, the bigger the move." I am sticking with my view that $40k should be seen as a very realistic target.
You can measure the height of the pattern (roughly $20-$3=$17k on top of the breakout level), which points to $37k - or you could argue that the %% of the move below the break can be added to the breakout level, which suggests something like $80k or higher. Whichever target it will end up being, it will very likely be much higher than current levels.
I just hope it won't already have happened by the time the ink on this article dried. Or, in digital terms, between writing this and hitting the "publish" button.
My regular blog is the RRG Charts blog. If you would like to receive a notification when a new article is published there, simply "Subscribe" with your email address...
Julius de Kempenaer
Senior Technical Analyst, StockCharts.com
Creator, Relative Rotation Graphs
Founder, RRG Research
Host of: Sector Spotlight
Please find my handles for social media channels under the Bio below.
Feedback, comments or questions are welcome at Juliusdk@stockcharts.com. I cannot promise to respond to each and every message, but I will certainly read them and, where reasonably possible, use the feedback and comments or answer questions.
To discuss RRG with me on S.C.A.N., tag me using the handle Julius_RRG.
RRG, Relative Rotation Graphs, JdK RS-Ratio, and JdK RS-Momentum are registered trademarks of RRG Research.


