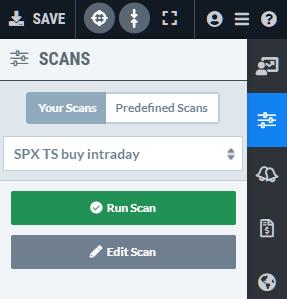
One of the BIG improvements or advantages in ACP is the fact that I can run a scan in the side-bar, then immediately click on the symbol to bring up the chart.
One of the scans that I use frequently is the 'Turtle Soup" scan on intraday data. Those of you who have added the Turtle Soup scan from one of the articles that I wrote on this setup (by Larry Connors and Linda Raschke) can simply open this scan and run it within ACP.
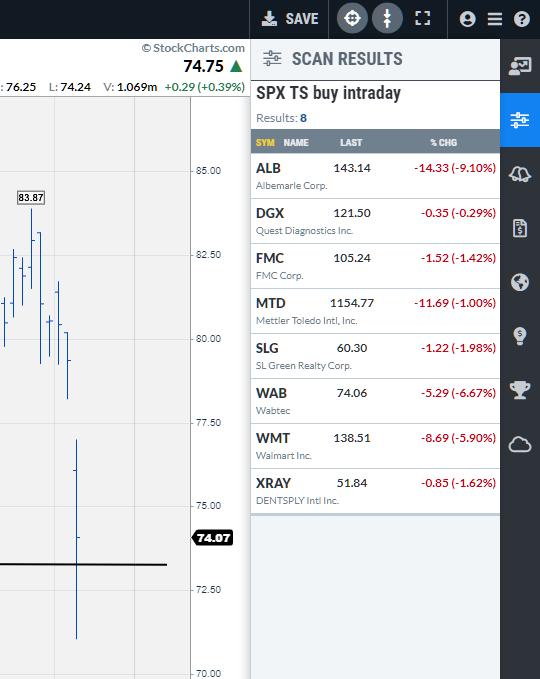
Today, around 2:20pm, this scan showed the following tickers:
And the fact that they are listed in the side-bar enables me to simply click on the symbol and bring up the chart.
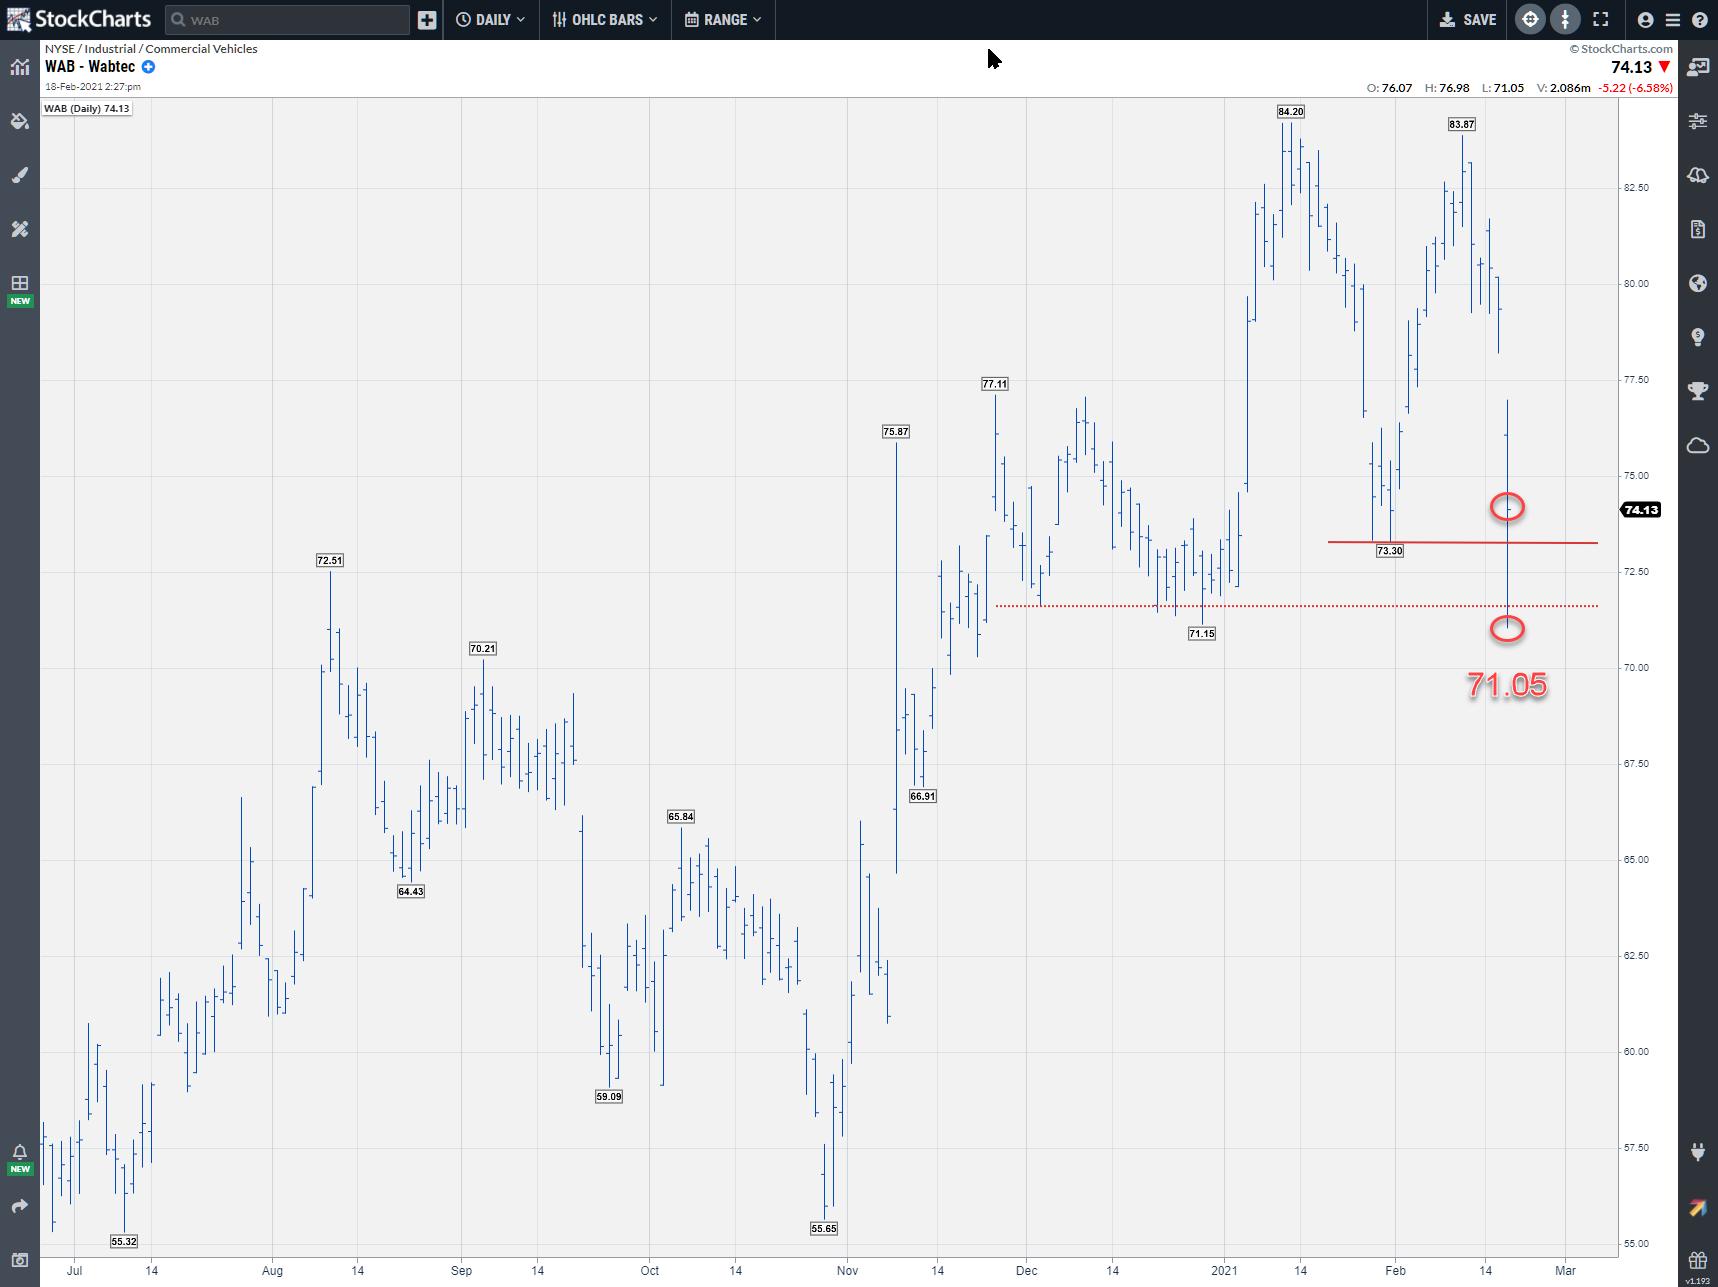
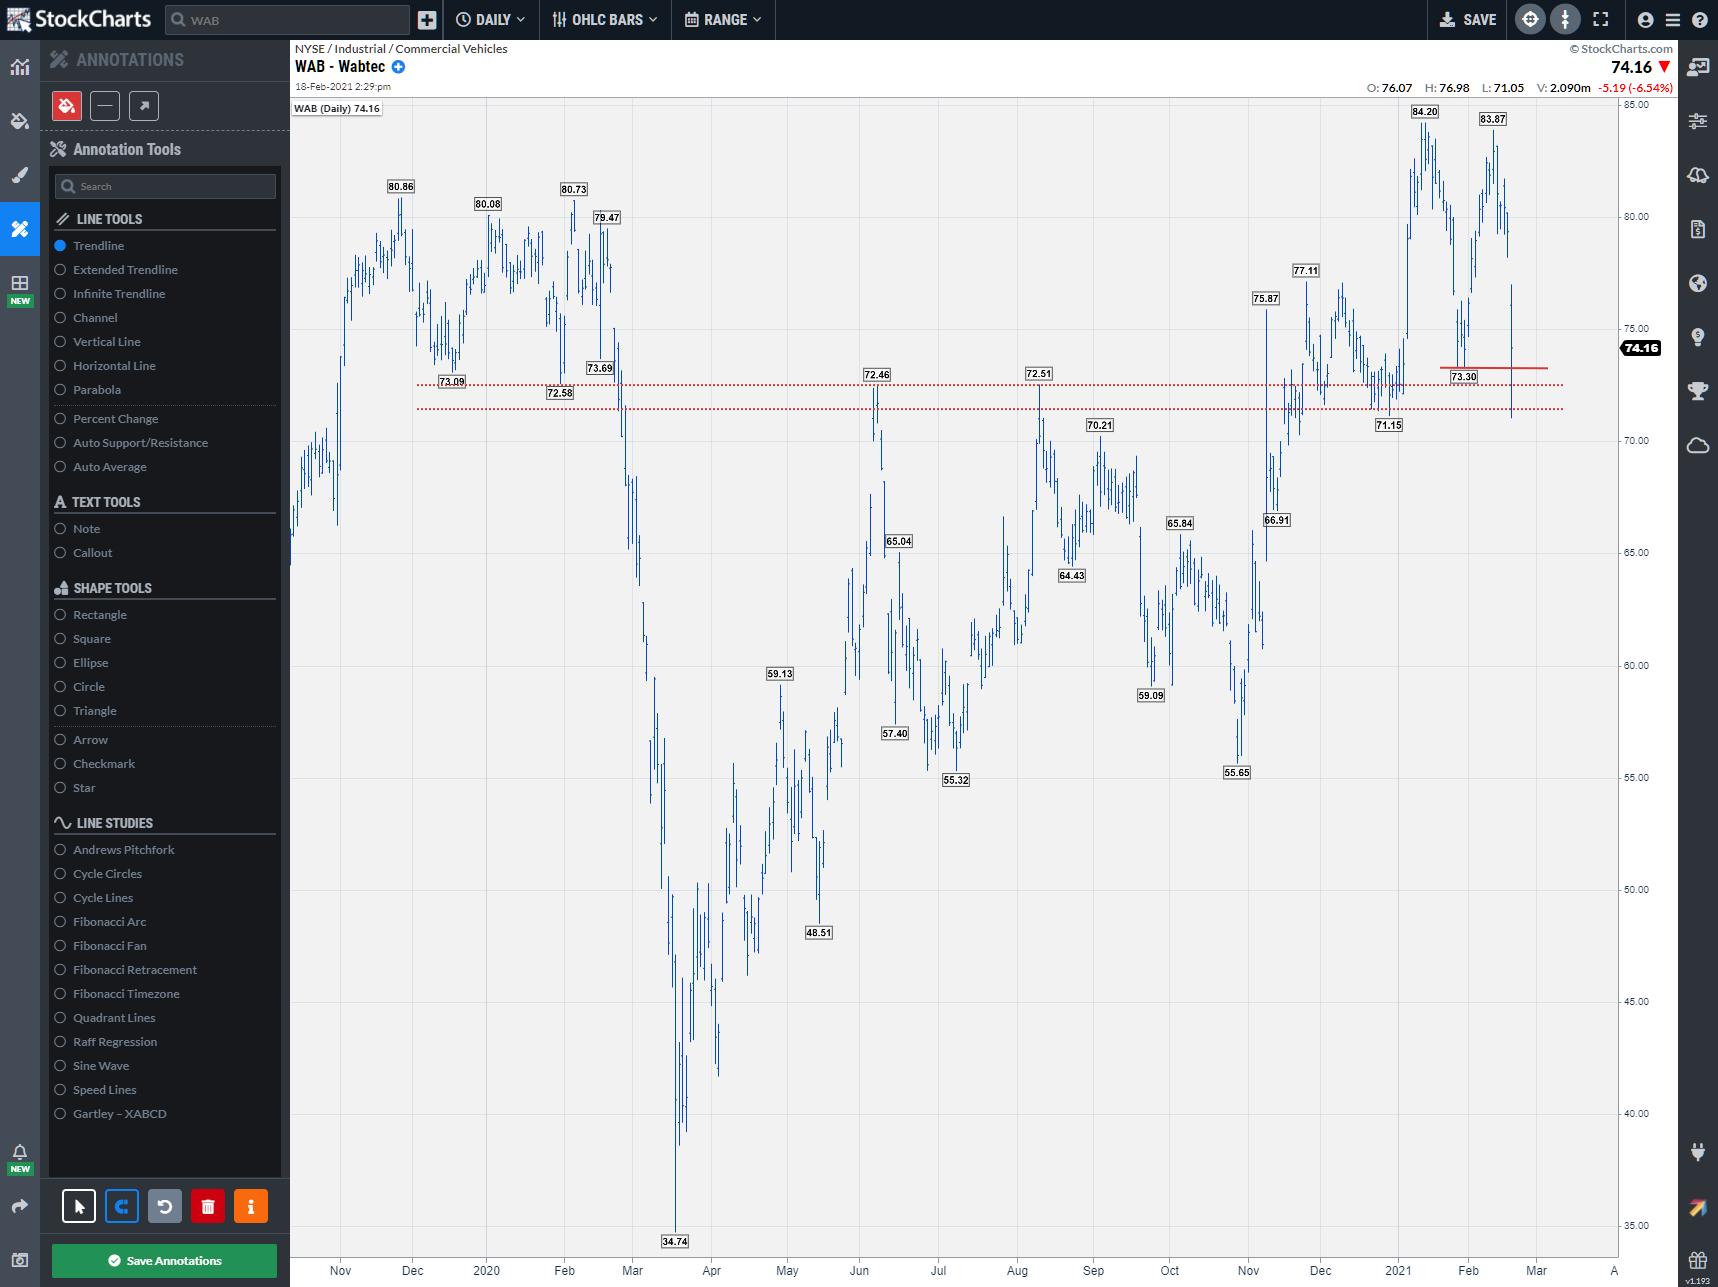
While browsing through the list I noticed the chart of WAB. Earlier today, the price dropped below its 20-day low, which was at 73.30, to find a low at 71.05. Out of that low, the price then rallied back above that previous 20-day low, which triggers the setup. So, in this case, the trade was triggered/entered just above 73.30, say 73.50. And following the rules of the setup ,a stop-loss should be placed just below today's low, i.e. ~71.
Additional confidence to enter this trade can be found in the fact that today's low is formed in a longer-term support zone between 71.00-72.50.
My regular blog is the RRG Charts blog. If you would like to receive a notification when a new article is published there, simply "Subscribe" with your email address.
Julius de Kempenaer
Senior Technical Analyst, StockCharts.com
Creator, Relative Rotation Graphs
Founder, RRG Research
Host of: Sector Spotlight
Please find my handles for social media channels under the Bio below.
Feedback, comments or questions are welcome at Juliusdk@stockcharts.com. I cannot promise to respond to each and every message, but I will certainly read them and, where reasonably possible, use the feedback and comments or answer questions.
To discuss RRG with me on S.C.A.N., tag me using the handle Julius_RRG.
RRG, Relative Rotation Graphs, JdK RS-Ratio, and JdK RS-Momentum are registered trademarks of RRG Research.


