The RRG above shows the rotations for two relationships that can help you get a handle for the market as a whole:
- Growth vs Value: Generally, when growth stocks are doing well and outperforming value, that is good for the market - whereas, vice versa, when value stocks are outperforming their growth counterparts, that points to weakness or a risk-off attitude in markets.
- Staples vs Discretionary: When Discretionary beats Staples, that is usually a good sign for the market; v.v. when Staples outperform Discretionary, as that indicates risk-off.
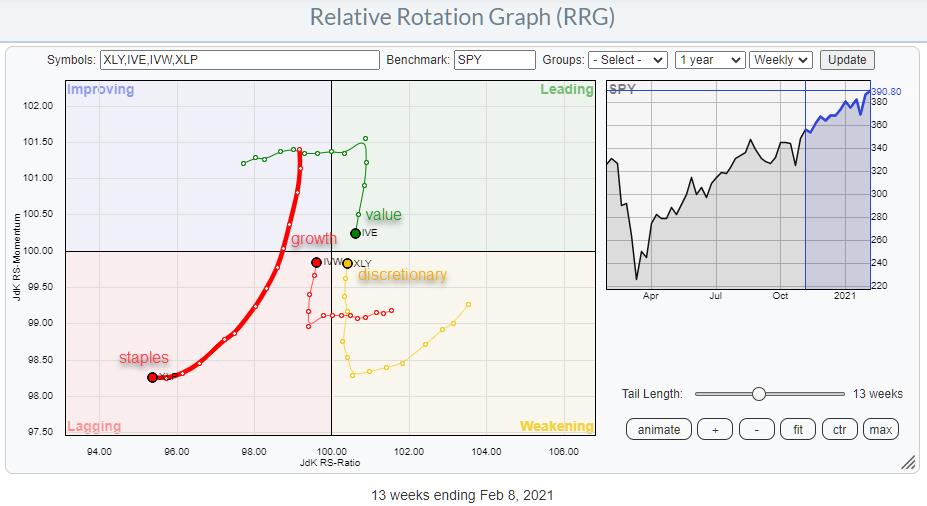
In the RRG above, I have plotted the tails for XLY (Discretionary) and XLP (Staples), together with IVE (Value) and IVW (Growth). If we start with growth/value, you can see that value, inside leading, is to the right of growth, in lagging. But the direction of their paths is suggesting a return for IVW into leading and a drop into weakening (and possibly lagging) for value.
The current positioning for those tails comes after a rotation that was clearly in favor for value over growth, but now seems to be coming to an end and changing back to favoring growth over value.
Staples vs Discretionary
The tail for XLP is the longest on the chart and pushing further and further into the lagging quadrant. It has lost some of its downward momentum recently, but the weakness is still clearly visible.
Discretionary, on the other hand, is positioned inside weakening, but gaining on the JdK RS-Momentum scale for weeks already and now about to move into the leading quadrant again. This will re-confirm the strength of the Discretionary sector over Staples.
With both these gauges on a positive reading, it's hard to be bearish for the market (SPY). As long as this setup holds, declines are buying opportunities.
My regular blog is the RRG Charts blog. If you would like to receive a notification when a new article is published there, simply "Subscribe" with your email address.
Julius de Kempenaer
Senior Technical Analyst, StockCharts.com
Creator, Relative Rotation Graphs
Founder, RRG Research
Host of: Sector Spotlight
Please find my handles for social media channels under the Bio below.
Feedback, comments or questions are welcome at Juliusdk@stockcharts.com. I cannot promise to respond to each and every message, but I will certainly read them and, where reasonably possible, use the feedback and comments or answer questions.
To discuss RRG with me on S.C.A.N., tag me using the handle Julius_RRG.
RRG, Relative Rotation Graphs, JdK RS-Ratio, and JdK RS-Momentum are registered trademarks of RRG Research.


