Developments in the technology sector keep me busy, but above all alert.
First of all it's the biggest sector in the S&P 500 and therefore by default an important one to watch. Primarily because you need a lot of power to push the S&P higher when technology is not participating.
On the weekly Relative Rotation Graph, the three largest sectors, Technology, Discretionary, and Health Care are all positioned inside the lagging quadrant. That makes it even more difficult. On the daily RRG the picture has shifted a bit in favor of XLK and XLY but XLV is also pushing further into lagging on that shorter time frame.
So the first question is; will this short term improvement for XLY and XLK be strong enough to turn the weekly tails for those sectors around and back up towards improving? My judgement at the moment; Unlikely, but even IF it happens it will probably be a slow process. All in all that makes me cautious for the S&P 500 in the near term.
Just be aware that "corrections" can also play out over time, it does not necessarily have to be a decline in price. Corrections IMHO are periods in which the market digests the recent buying activity that drove the rally so far.
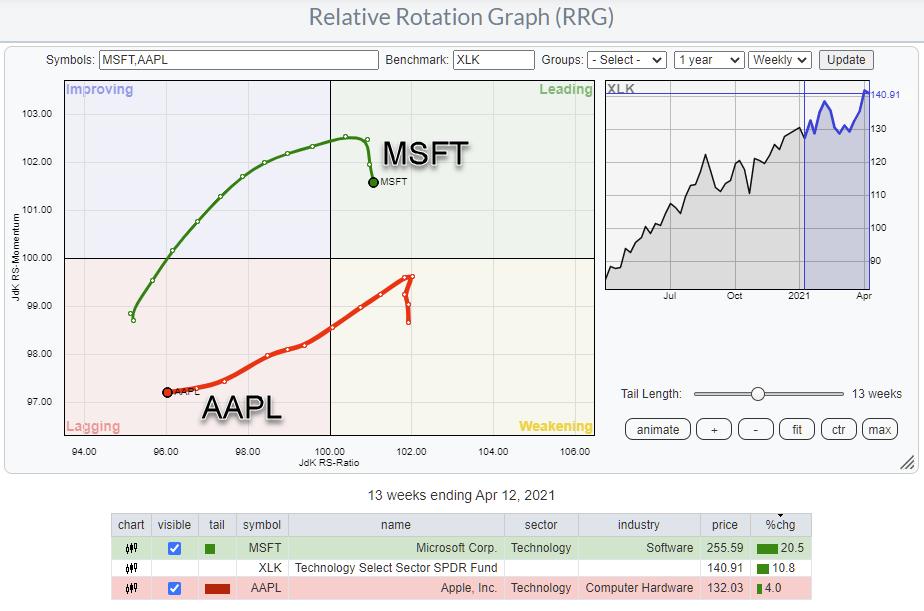
A closer look into the technology sector reveals that pretty much one stock managed to hold up the performance of the sector in recent months. And that is MSFT.
The RRG above isolates the rotations for AAPL and MSFT over the last 13 weeks (quarter). As you can see, and probably already know. AAPL has been the big lagger in the sector. But over the same period MSFT managed to outperform big-time, dragging the sector higher, even despite the relative weakness in AAPL.
So the tail of the MSFT rolling over inside the leading quadrant at relatively low RS-Ratio values is something that puts me on alert.
When both AAPL and MSFT will be showing relative weakness vs XLK and XLK (together with XLY and XLV) shows weakness against SPY it will be very hard for SPY to continue its rally at the recent pace and it may be time for a bit of cooling down, digesting. Even if only in a sideways fashion.
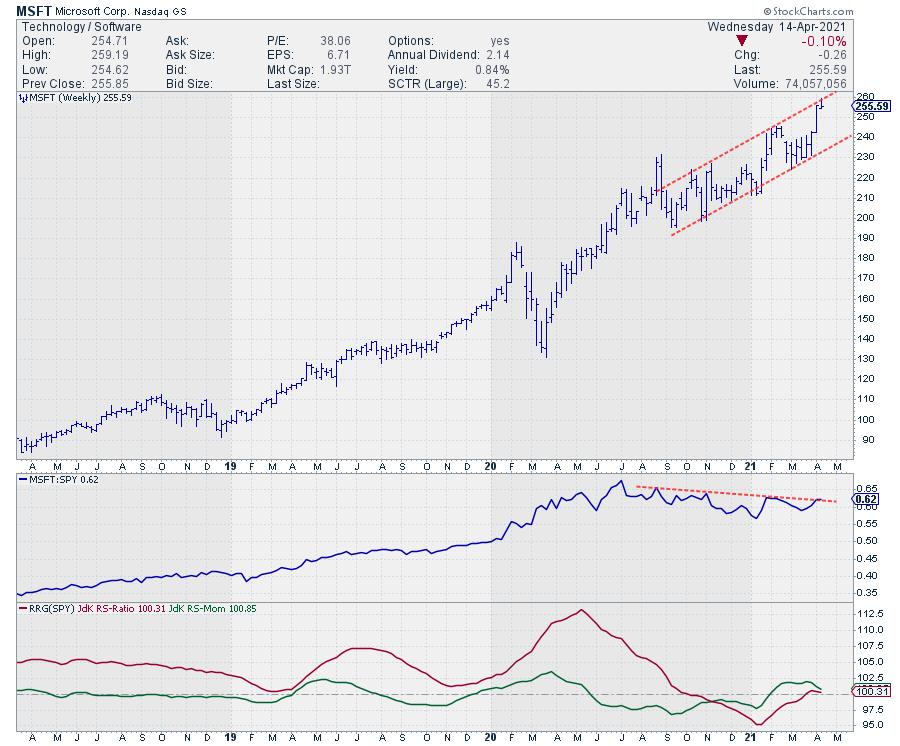
On the weekly chart relative strength of MSFT vs SPY is hitting overhead resistance while RS-Momentum is rolling over downwards again after the first period of weakness in the last few months of 2020.
On the price chart MSFT is bouncing against the rising resistance line which is keeping the stock under pressure for now.
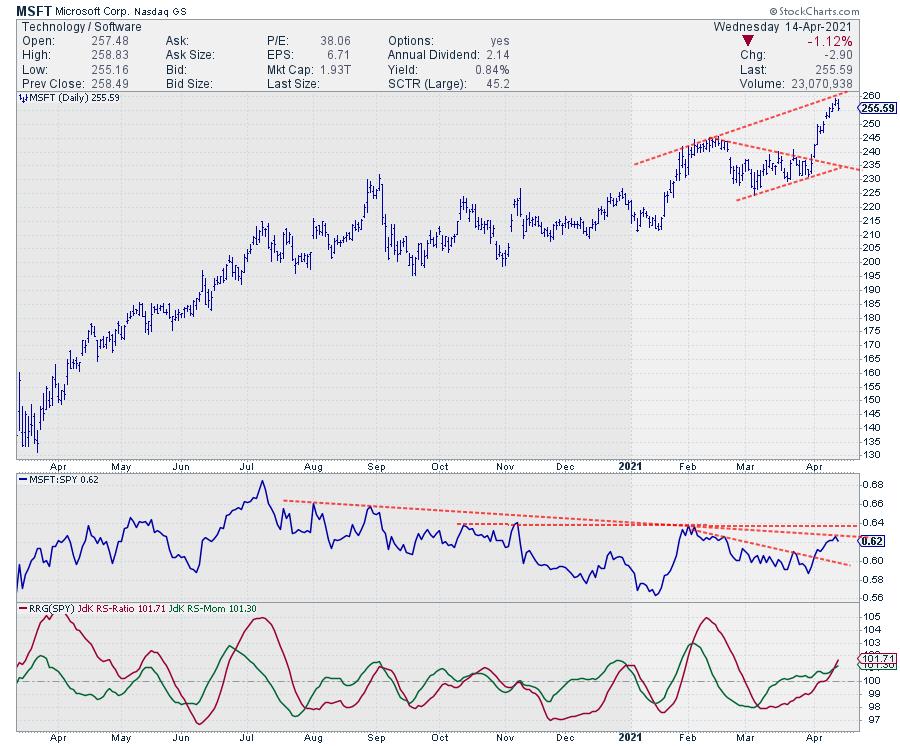
The daily chart shows the same resistance in price showing up as seen on the weekly chart. The RRG=Lines are pointing higher as they are picking up the short term improvement over the last few weeks. But on the relative chart a lot of overhead resistance is clustering slightly above current levels. Unless this cluster of relative resistance can be broken, it will be difficult for the RRG-Lines to push higher.
All in all it seems a tough case for MSFT to push significantly higher under these circumstances and that makes it hard for XLK to push higher and that makes it hard for the S&P 500 to push higher.
#StaySafe, --Julius
My regular blog is the RRG Charts blog. If you would like to receive a notification when a new article is published there, simply "Subscribe" with your email address.
Julius de Kempenaer
Senior Technical Analyst, StockCharts.com
Creator, Relative Rotation Graphs
Founder, RRG Research
Host of: Sector Spotlight
Please find my handles for social media channels under the Bio below.
Feedback, comments or questions are welcome at Juliusdk@stockcharts.com. I cannot promise to respond to each and every message, but I will certainly read them and, where reasonably possible, use the feedback and comments or answer questions.
To discuss RRG with me on S.C.A.N., tag me using the handle Julius_RRG.
RRG, Relative Rotation Graphs, JdK RS-Ratio, and JdK RS-Momentum are registered trademarks of RRG Research.


