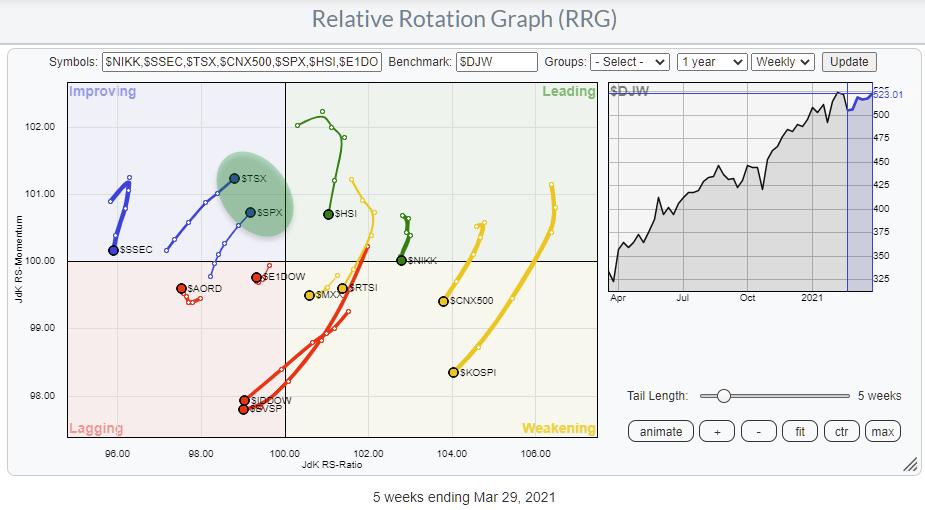
With the S&P 500 jumping to new highs, it's interesting to see how that impacts the position and the rotation of the US vs. the rest of the world.
The RRG above visualizes that. The highlighted area shows both the S&P and the Candian TSX inside the improving quadrant and rotating towards leading. Compared with the other indexes on this RRG, they are the only two moving at a positive RRG-Heading (0-90 degrees). That means that these markets are rapidly picking up strength vs. the rest of the world in this universe.
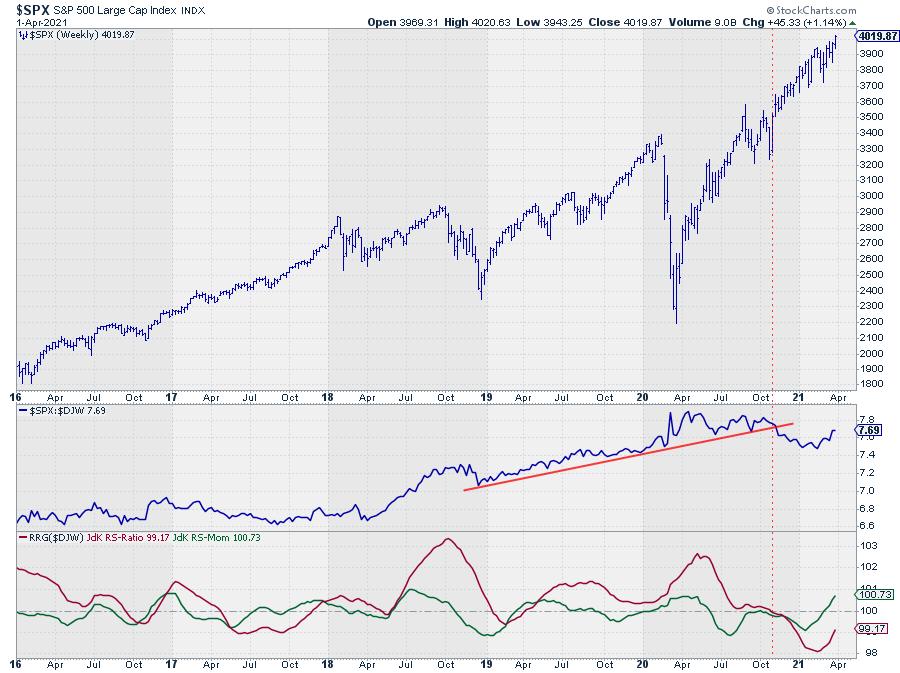
Looking at the price chart above, it is clear that the recent push to new highs is confirming that the uptrend is still alive and kicking.
The relative strength vs. the DJ Global index is a different story. At the start of November, both RRG-Lines dropped below the 100-level at the same time when the RS-Line broke its rising support line. From that point onwards, the US started lagging behind the performance of the Global index.
That trend seems to be changing again now. The RRG-Lines have both started to rise again, causing a rotation of the S&P into the improving quadrant and heading towards leading. That seems to be an early signal because, based on a visual inspection, the raw RS-Line cannot really be seen as "back in an uptrend."
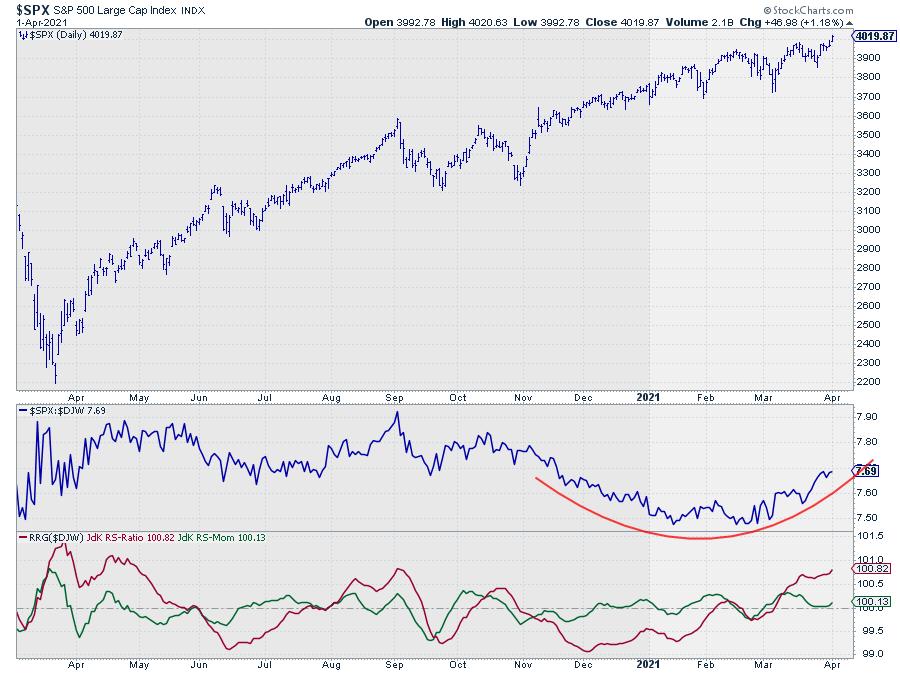
The daily chart shows that turnaround in a bit more detail and clearer, IMHO.
The rounding bottom in the RS-Line shows a slow-but-sure rotation from a period of underperformance vs. the world into outperformance since early March. Combining these two charts and the current rotation on the RRG puts the US (S&P) back to the forefront of stock markets worldwide again. Together with Canada.
#StaySafe, --Julius
My regular blog is the RRG Charts blog. If you would like to receive a notification when a new article is published, simply "Subscribe" with your email address.
Julius de Kempenaer
Senior Technical Analyst, StockCharts.com
Creator, Relative Rotation Graphs
Founder, RRG Research
Host of: Sector Spotlight
Please find my handles for social media channels under the Bio below.
Feedback, comments or questions are welcome at Juliusdk@stockcharts.com. I cannot promise to respond to each and every message, but I will certainly read them and, where reasonably possible, use the feedback and comments or answer questions.
To discuss RRG with me on S.C.A.N., tag me using the handle Julius_RRG.
RRG, Relative Rotation Graphs, JdK RS-Ratio, and JdK RS-Momentum are registered trademarks of RRG Research.


