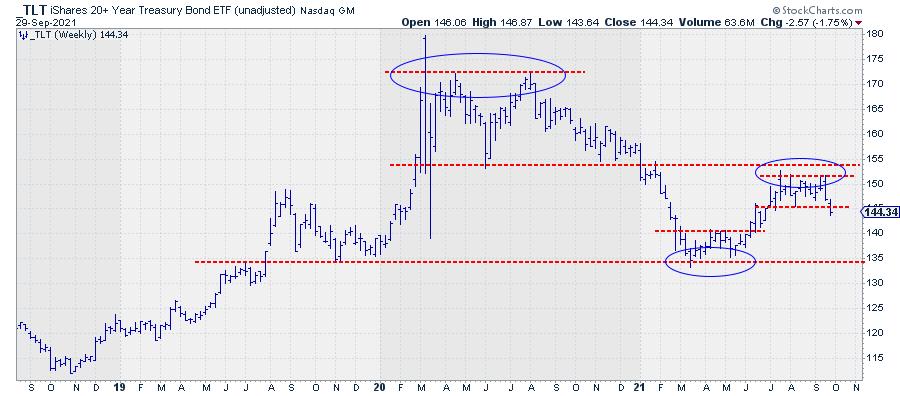
The Bond Market Holds all the keys. And one of the key charts here is TLT.
After setting a big double top in 2020 and completing it at the end of the year, the start of 2021 was characterized by an acceleration lower, pushing yields higher. Support was found around the same levels as in 2019, in the 135 area. From March to June 2021, a small(er) double bottom was formed just above that area, followed by an upward break that completed that double top, sending prices back up. From July onwards, another consolidation, in the shape of another double top, formed just below the former breakout level, which never got challenged. And now we are seeing the completion of that new double top as TLT is breaking lower.
Looking at the bigger picture here we see a lower low, the double bottom after breaking from the major double top, and a lower high, the second double top, in place.
Taking into account the duration over which this has been developing and the price swings we have seen in the process...
This could become "a thing".
Support levels are found near 140, intermediate, and then 135, major.
My regular blog is the RRG Charts blog. If you would like to receive a notification when a new article is published there, "Subscribe" with your email address.
Julius de Kempenaer
Senior Technical Analyst, StockCharts.com
Creator, Relative Rotation Graphs
Founder, RRG Research
Host of: Sector Spotlight
Please find my handles for social media channels under the Bio below.
Feedback, comments or questions are welcome at Juliusdk@stockcharts.com. I cannot promise to respond to each and every message, but I will certainly read them and, where reasonably possible, use the feedback and comments or answer questions.
To discuss RRG with me on S.C.A.N., tag me using the handle Julius_RRG.
RRG, Relative Rotation Graphs, JdK RS-Ratio, and JdK RS-Momentum are registered trademarks of RRG Research.


