Over the past few weeks, I have been pointing out conflicting rotations for sectors on Relative Rotation Graphs, the negative divergence between RSI and SPY and a few more arguments that signal caution.With regard to the S&P, that has not paid off.... yet. The US stock market, more specifically the S&P 500 kept creeping higher recently -- much to my, and many others', frustration.
However, if you take a step back and take a look at the big(ger) picture -- which, by the way, is exactly what Relative Rotation Graphs help you to do -- a case can be made that the US/SPY is the odd one out. An important one, obviously, as the US market is the biggest chunk in every global index.
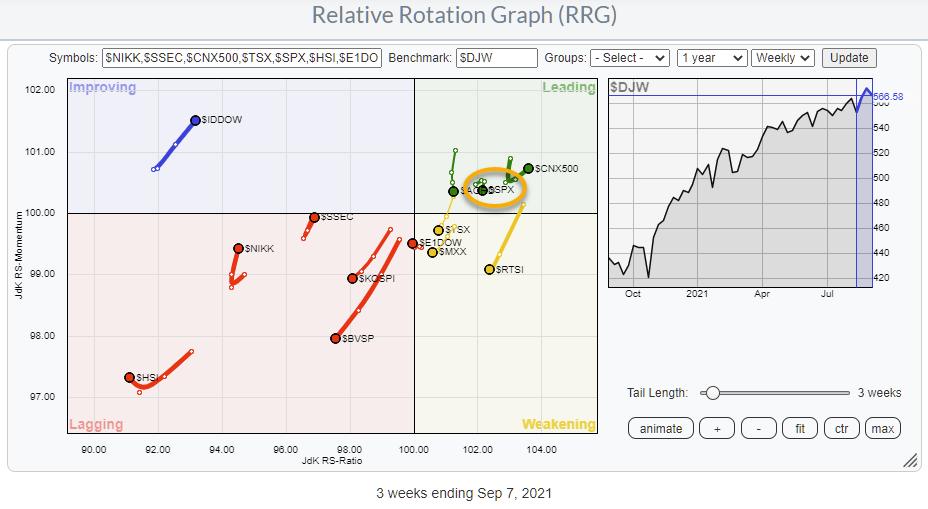
The benchmark for this RRG is the DJ Global index and, although the list of indexes on the plot does not completely cover the members of the benchmark, we can clearly see the concentration of markets inside the red, lagging quadrant as well as the dominant-negative RRG-Heading.
Most of these markets are showing quite weak charts, many of them in combination with a strong negative divergence between price and RSI, as well as MACD/PPO.
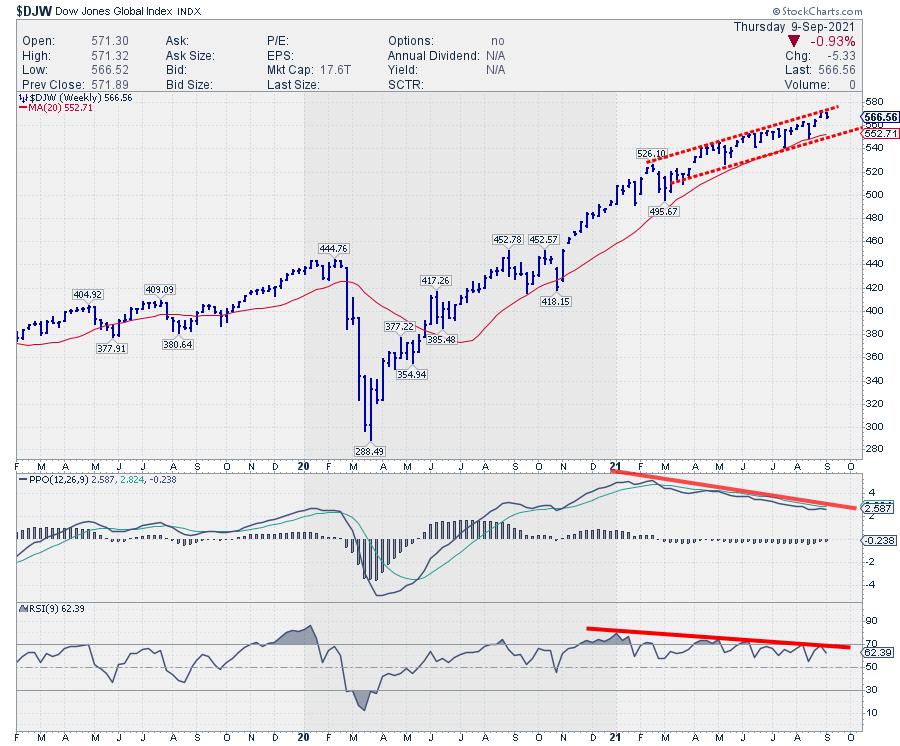
The chart at the top of this article is the Dow Jones Global index, and the divergence that is showing up on this chart is getting stronger by the week and has already been building up since the start of the year.
Now, a negative divergence by itself is not enough to pull the trigger. An "event" on the price chart is needed to make that divergence meaningful. And, for the global stock market index, I am looking at a break below the 20-week MA which is at the moment coinciding with a rising support line around 550.
With the US inside the leading quadrant at a very short tail, it certainly looks like the US is holding up the world. The question is, for how long?
There are a few more interesting tails on this RRG which I am planning to discuss in my ChartWatchers article this upcoming weekend.
#StaySafe, --Julius
My regular blog is the RRG Charts blog. If you would like to receive a notification when a new article is published there, "Subscribe" with your email address.
Julius de Kempenaer
Senior Technical Analyst, StockCharts.com
Creator, Relative Rotation Graphs
Founder, RRG Research
Host of: Sector Spotlight
Please find my handles for social media channels under the Bio below.
Feedback, comments or questions are welcome at Juliusdk@stockcharts.com. I cannot promise to respond to each and every message, but I will certainly read them and, where reasonably possible, use the feedback and comments or answer questions.
To discuss RRG with me on S.C.A.N., tag me using the handle Julius_RRG.
RRG, Relative Rotation Graphs, JdK RS-Ratio, and JdK RS-Momentum are registered trademarks of RRG Research.


