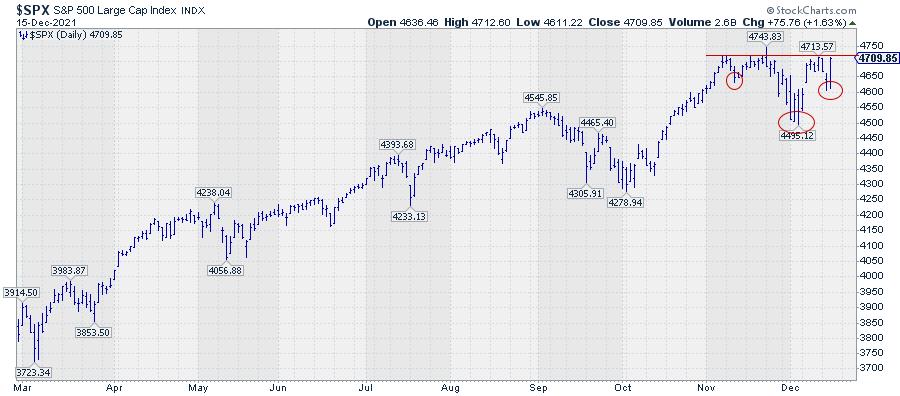
After dipping to 4500, the development of a potential inverted head-and-shoulders pattern started to take shape on the price chart of the S&P 500.
The overhead resistance just above 4700 has already been developing since the market first reached that area at the start of November. Very recently, this level was once again established as overhead resistance when the market failed again to break higher and put in a peak at 4713. Yesterday's rally stopped just short of 4710, once again challenging that resistance barrier. However, the pattern that developed below that resistance area since the first test in November took the shape of an inverted H&S formation. Most occurrences for this type of pattern signal a trend reversal (from down to up). Given the location and the size of the formation, in combination with the uptrend still being in play, I think this qualifies as an H&S continuation pattern, which occurs much less frequently.
In order to trigger a completed formation, we need to see a close above the neckline, let's say 4715. When that happens, we can calculate a potential target for a new rally around 4900. The "height" of the formation is measured from the lowest point to the neckline, which is roughly 200 points. These 200 points may then be projected upward from the level of the breakout, which comes out around 4900.
So in the coming days: All eyes on a close above 4715!
--Julius
My regular blog is the RRG Charts blog. If you would like to receive a notification when a new article is published there, "Subscribe" with your email address.
Julius de Kempenaer
Senior Technical Analyst, StockCharts.com
Creator, Relative Rotation Graphs
Founder, RRG Research
Host of: Sector Spotlight
Please find my handles for social media channels under the Bio below.
Feedback, comments or questions are welcome at Juliusdk@stockcharts.com. I cannot promise to respond to each and every message, but I will certainly read them and, where reasonably possible, use the feedback and comments or answer questions.
To discuss RRG with me on S.C.A.N., tag me using the handle Julius_RRG.
RRG, Relative Rotation Graphs, JdK RS-Ratio, and JdK RS-Momentum are registered trademarks of RRG Research.


