One of my favorite ratios, and it's a very simple one, is comparing NASDAQ 100 performance vs. the S&P 500 (QQQ:SPY). History tells us that the more aggressive QQQ performs better on a relative basis during bullish cycles, while the SPY performs better during bearish cycles. But divergences do occur at tops and bottoms as Wall Street repositions ahead of key market reversals. I find it interesting that money has been rotating back to the QQQ just as this bear market seems to be gaining momentum:
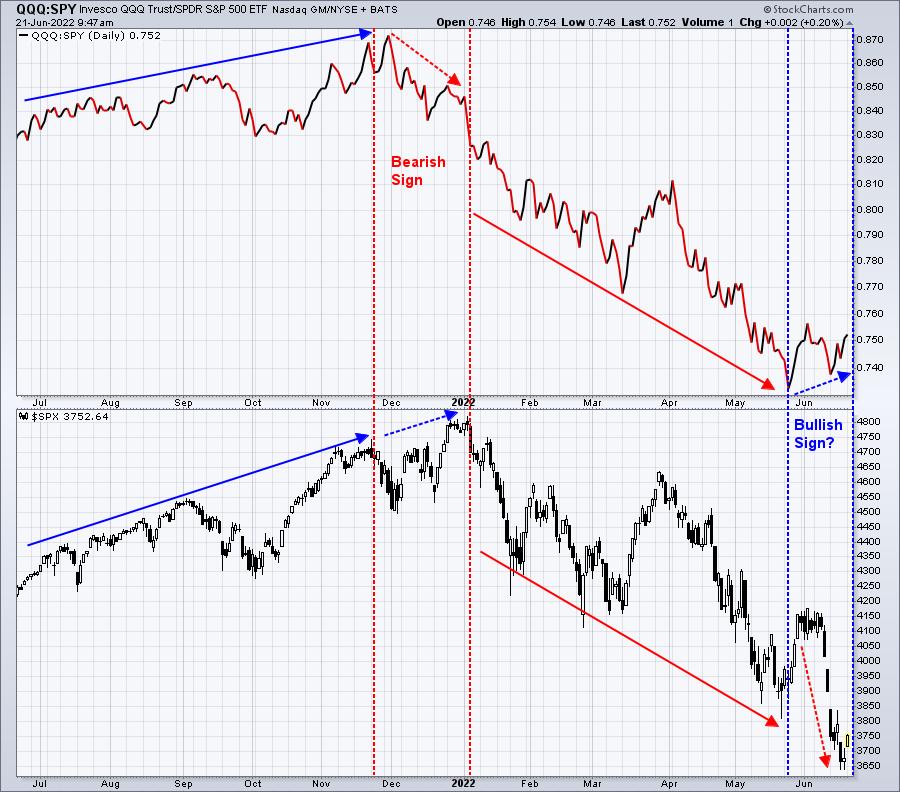
If the S&P 500 continues moving lower and the QQQ:SPY rolls over and prints a new low, then I'd disregard this chart as bullish. If, however, the QQQ:SPY ratio has bottomed, we should at least be considering the possibility that so has the S&P 500.
If you'd like brief, thought-provoking charts like the one above, please SIGN UP for our FREE EB Digest newsletter at EarningsBeats.com. There is no credit card required and you may unsubscribe at any time. Also, be sure to subscribe to the "Don't Ignore This Chart" blog below by scrolling down, providing your email address and hitting the green subscribe button. That way, as soon as DITC blog articles are published by me or others, they'll be sent directly to your email.
Happy trading!
Tom Bowley, Chief Market Strategist
EarningsBeats.com


