Yes, Technical Analysis can be (very) subjective at times. Different (types of) investors interpret charts differently. And yes, more quant-based technical approaches can make interpretation of charts or time series less subjective. Personally, I am probably somewhere in the middle of the spectrum.
BUT, looking at the chart of the S&P 500 index at the moment, I have to admit to myself that, from time to time, it is amazing how well a market responds to all these "subjective" support and resistance levels.
Anyone who has studied some Technical Analysis 101 will very likely have picked up two "rules" or "assumptions" if you wish.
- Old support comes back as resistance (and vice versa)
- Gaps must be/are often filled
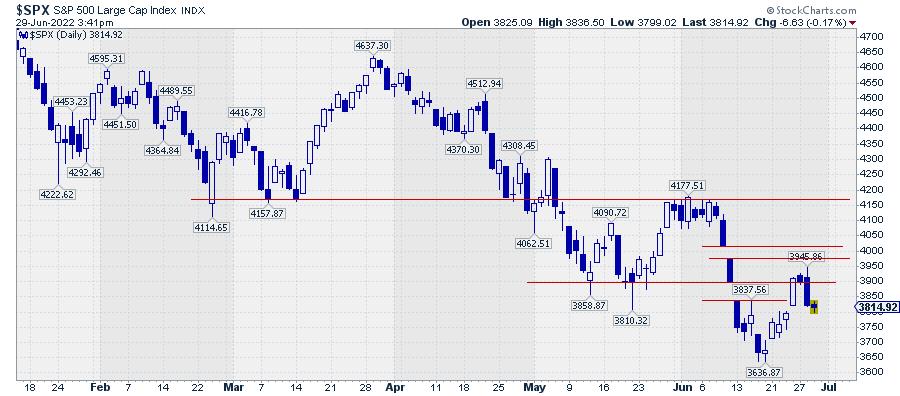
The chart of the S&P currently shows a lot of that.
First, we have the support line around 4175, which was broken at the start of May and then acted as resistance after the rally back up after the initial decline. Then, in the first half of June, the newly formed support around 3900 was broken, and that level is now serving as resistance again after the past three days.
The decline out of the 4177.51 high is showing two down gaps. The first was on 10 June between 4017 - 3974, and the second one was on 13 June between 3900 - 3838. The latter was closed on 24 June, after which the market formed a new (lower) high and came down again.
Closing that gap and testing old support as resistance came after setting a new (lower) low near 3636, a little over a week ago. In that move up, another gap, upward this time, was formed on 24 June between 3802 - 3822. That gap was closed today, which makes it very interesting to see what will happen from here.
As the market continues to slide lower, the next target can be pegged around 3636, where the most recent low was formed. When we bounce upward from this gap support, it will be a small sign of improvement. Given the dominant trend being downward, I am still more leaning towards at least another test of support in the 3636 area in the near term.
Whatever happens, market and investor behavior around these old peaks and troughs never ceases to amaze me.
My regular blog is the RRG Charts blog. If you would like to receive a notification when a new article is published there, "Subscribe" with your email address.
Julius de Kempenaer
Senior Technical Analyst, StockCharts.com
Creator, Relative Rotation Graphs
Founder, RRG Research
Host of: Sector Spotlight
Please find my handles for social media channels under the Bio below.
Feedback, comments or questions are welcome at Juliusdk@stockcharts.com. I cannot promise to respond to each and every message, but I will certainly read them and, where reasonably possible, use the feedback and comments or answer questions.
To discuss RRG with me on S.C.A.N., tag me using the handle Julius_RRG.
RRG, Relative Rotation Graphs, JdK RS-Ratio, and JdK RS-Momentum are registered trademarks of RRG Research.


