In case you haven't followed my work, I was very bearish U.S. equities as we opened 2022. I didn't wait to see the carnage to tell you that there was carnage. I predicted the carnage before we ever saw it. Included in those bearish predictions was a wild prediction about Apple, Inc. (AAPL) on January 4th, 2022. I suggested that AAPL could fall 20-30%. You can check out what I wrote in the following article, "The Great Divide Presents Big Problems....and a Wild Prediction for Apple (AAPL)". After you read the article, make sure you "subscribe" to my Trading Places blog below the article. If you provide StockCharts.com your name and email address in the space provided, all of my Trading Places blog articles will be sent directly to your inbox as soon as my articles are published. That way, you won't miss another one.
In my January 7th ChartWatchers article, I published a chart of AAPL, showing the history of significant declines in its past and, once again, suggesting that AAPL could see a selloff of 20-30%. I went on to show a chart that would illustrate what AAPL would look like if it were to fall 35% - as it did in previous down cycles. Here's the chart I showed then, with the subsequent 2022 market action in the chart as well:
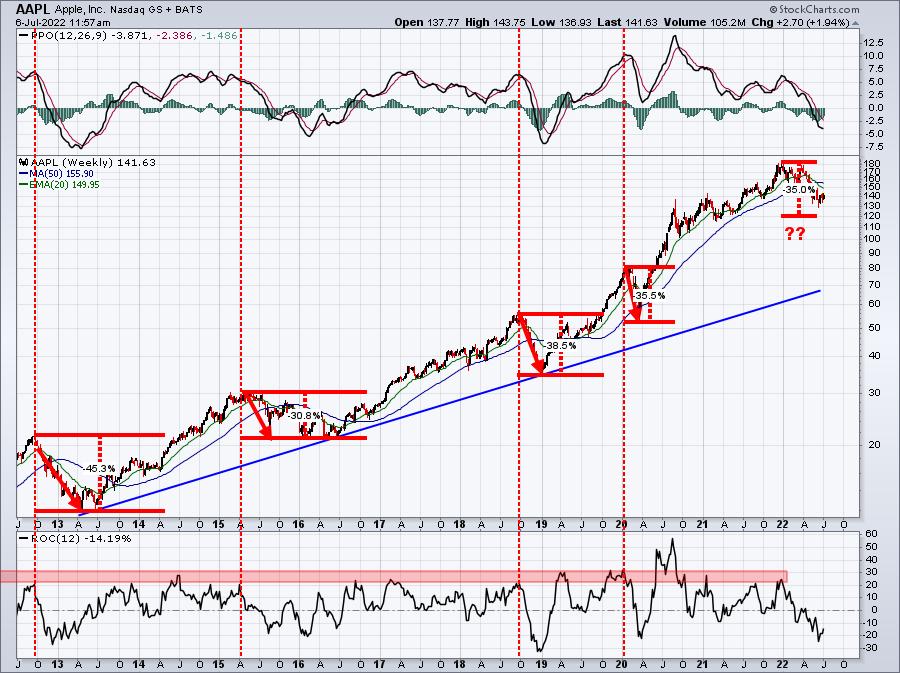
Now REMEMBER, this chart was provided in early January at the market top. There was no Monday morning quarterbacking here. There are a lot of perma-bull AAPL fans out there that criticized me at the time. But I'm sure they wish they had sold back then now.
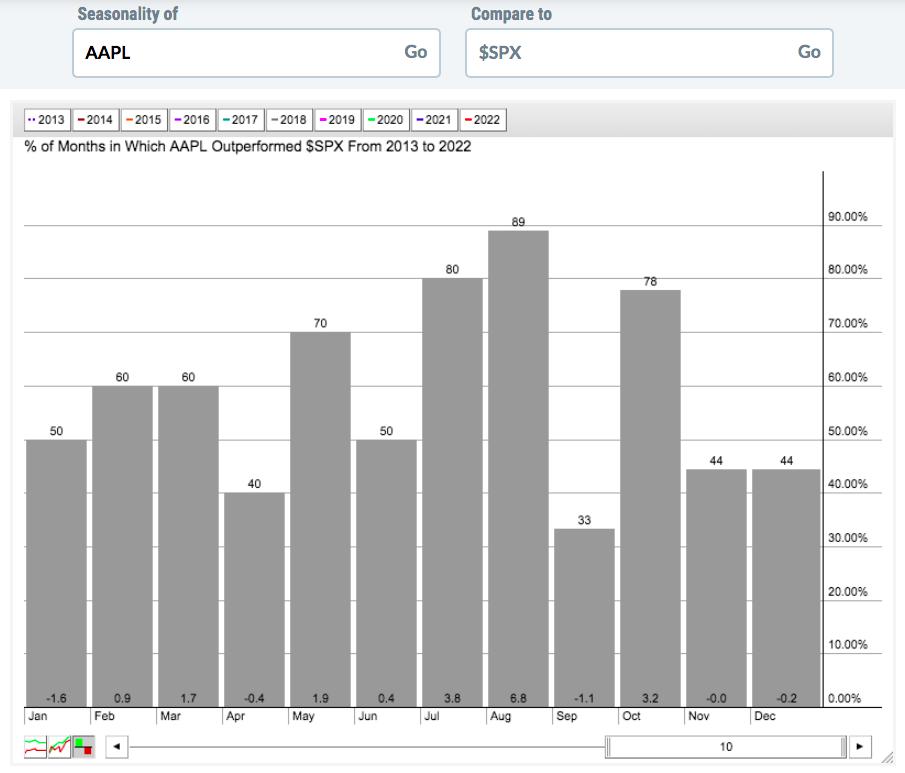
So what's my current thinking on AAPL? I LOVE IT! Could it move lower? Sure, but its history suggests that we buy these types of corrections. AAPL reached a low of 129.04 on June 16th, which represented a 29.27% decline off of its all-time high of 182.44 on January 4th, 2022. There's a historical component that makes AAPL very compelling right now. Since the S&P 500 broke out to new all-time highs on April 10, 2013 (clearing tops in 2000 and 2007), AAPL's best two consecutive calendar months for relative performance is July and August. You don't have to believe me, just look at this seasonal chart:
Finally, let's take a quick look at the positive divergence (slowing selling momentum) that's printed on AAPL's daily chart:
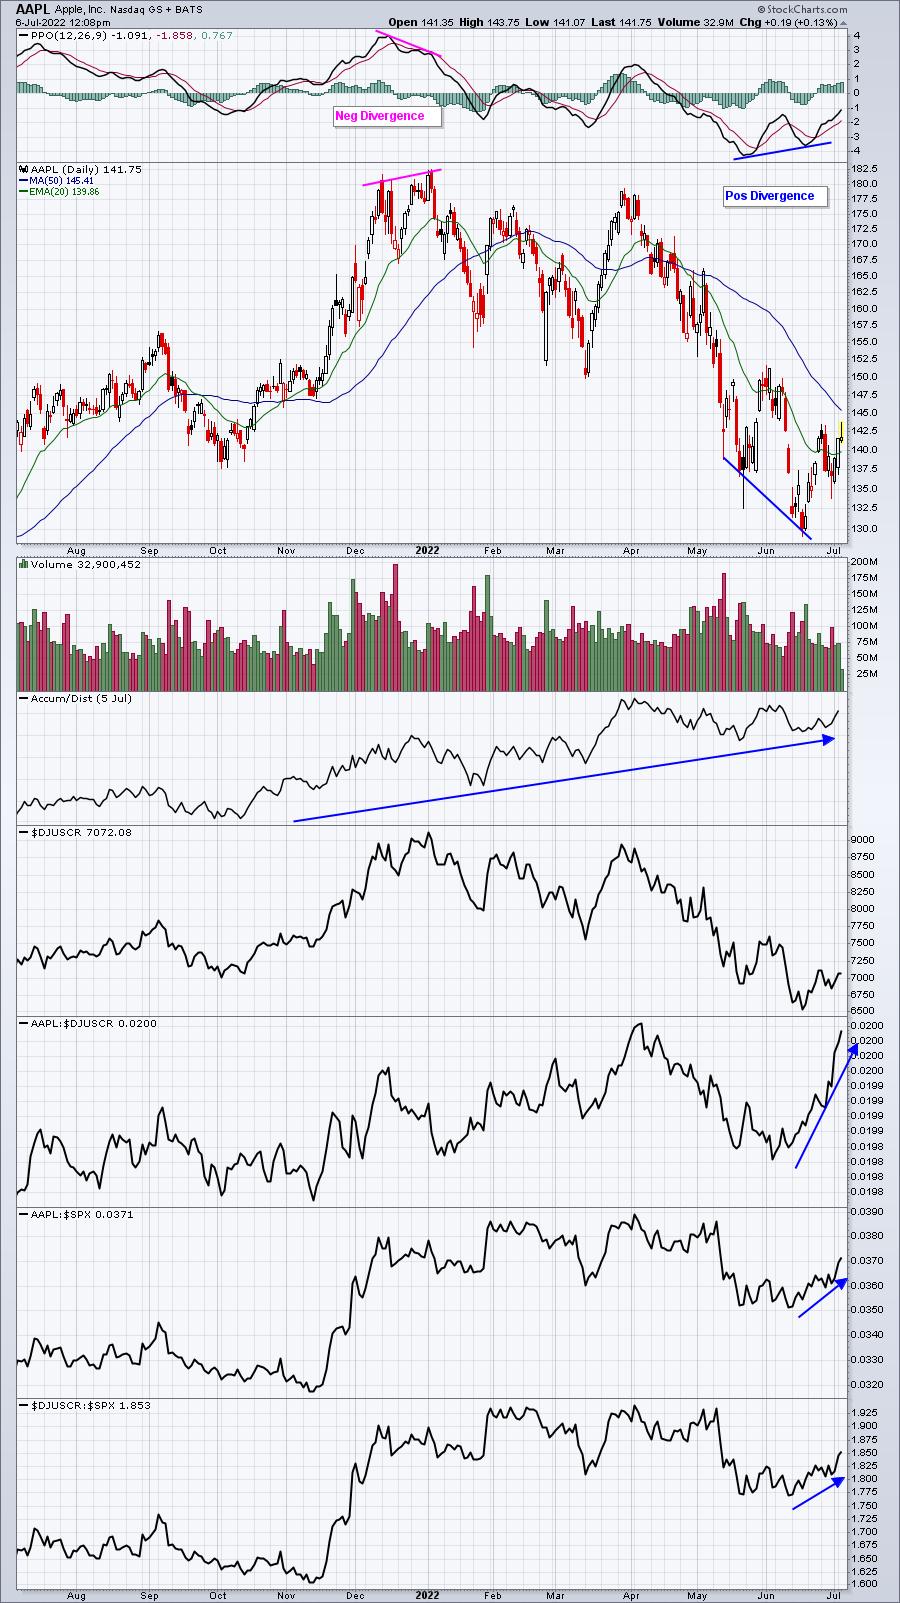
Note that AAPL flashed a negative divergence to support the notion of slowing buying momentum and the bearish theory back in January.
AAPL is just one piece of a July Seasonality Report that I'll be sending out to EarningsBeats.com members later today. If seasonality interests you and you'd like to view my entire July Seasonality Report, you can CLICK HERE (and then scroll down) to start a FREE 30-day trial to our service.
If you'd like to learn more about our style and strategies, you can subscribe HERE to our FREE 3x per week newsletter, EB Digest. This free newsletter requires no credit card and you may unsubscribe at any time!
Happy trading!
Tom Bowley, Chief Market Strategist, EarningsBeats.com


