Between 2012 and 2015, Gilead Sciences (GILD) enjoyed a nice rally. Since then, the stock has been through a rough patch. But its third-quarter 2022 earnings and revenue may be the spark the stock needed to bring it back to life.
GILD beat estimates when the company reported after the close on October 27, 2022. The strong earnings and 2023 guidance helped the stock rise 12.9% the following day. GILD's profits were mainly from its HIV and cancer drugs, a positive sign after sales of remdesivir, its COVID-19 treatment, didn't go as planned.
Looking at the daily chart of GILD (Chart 1), you can that the stock has been trending higher after basing for several months.
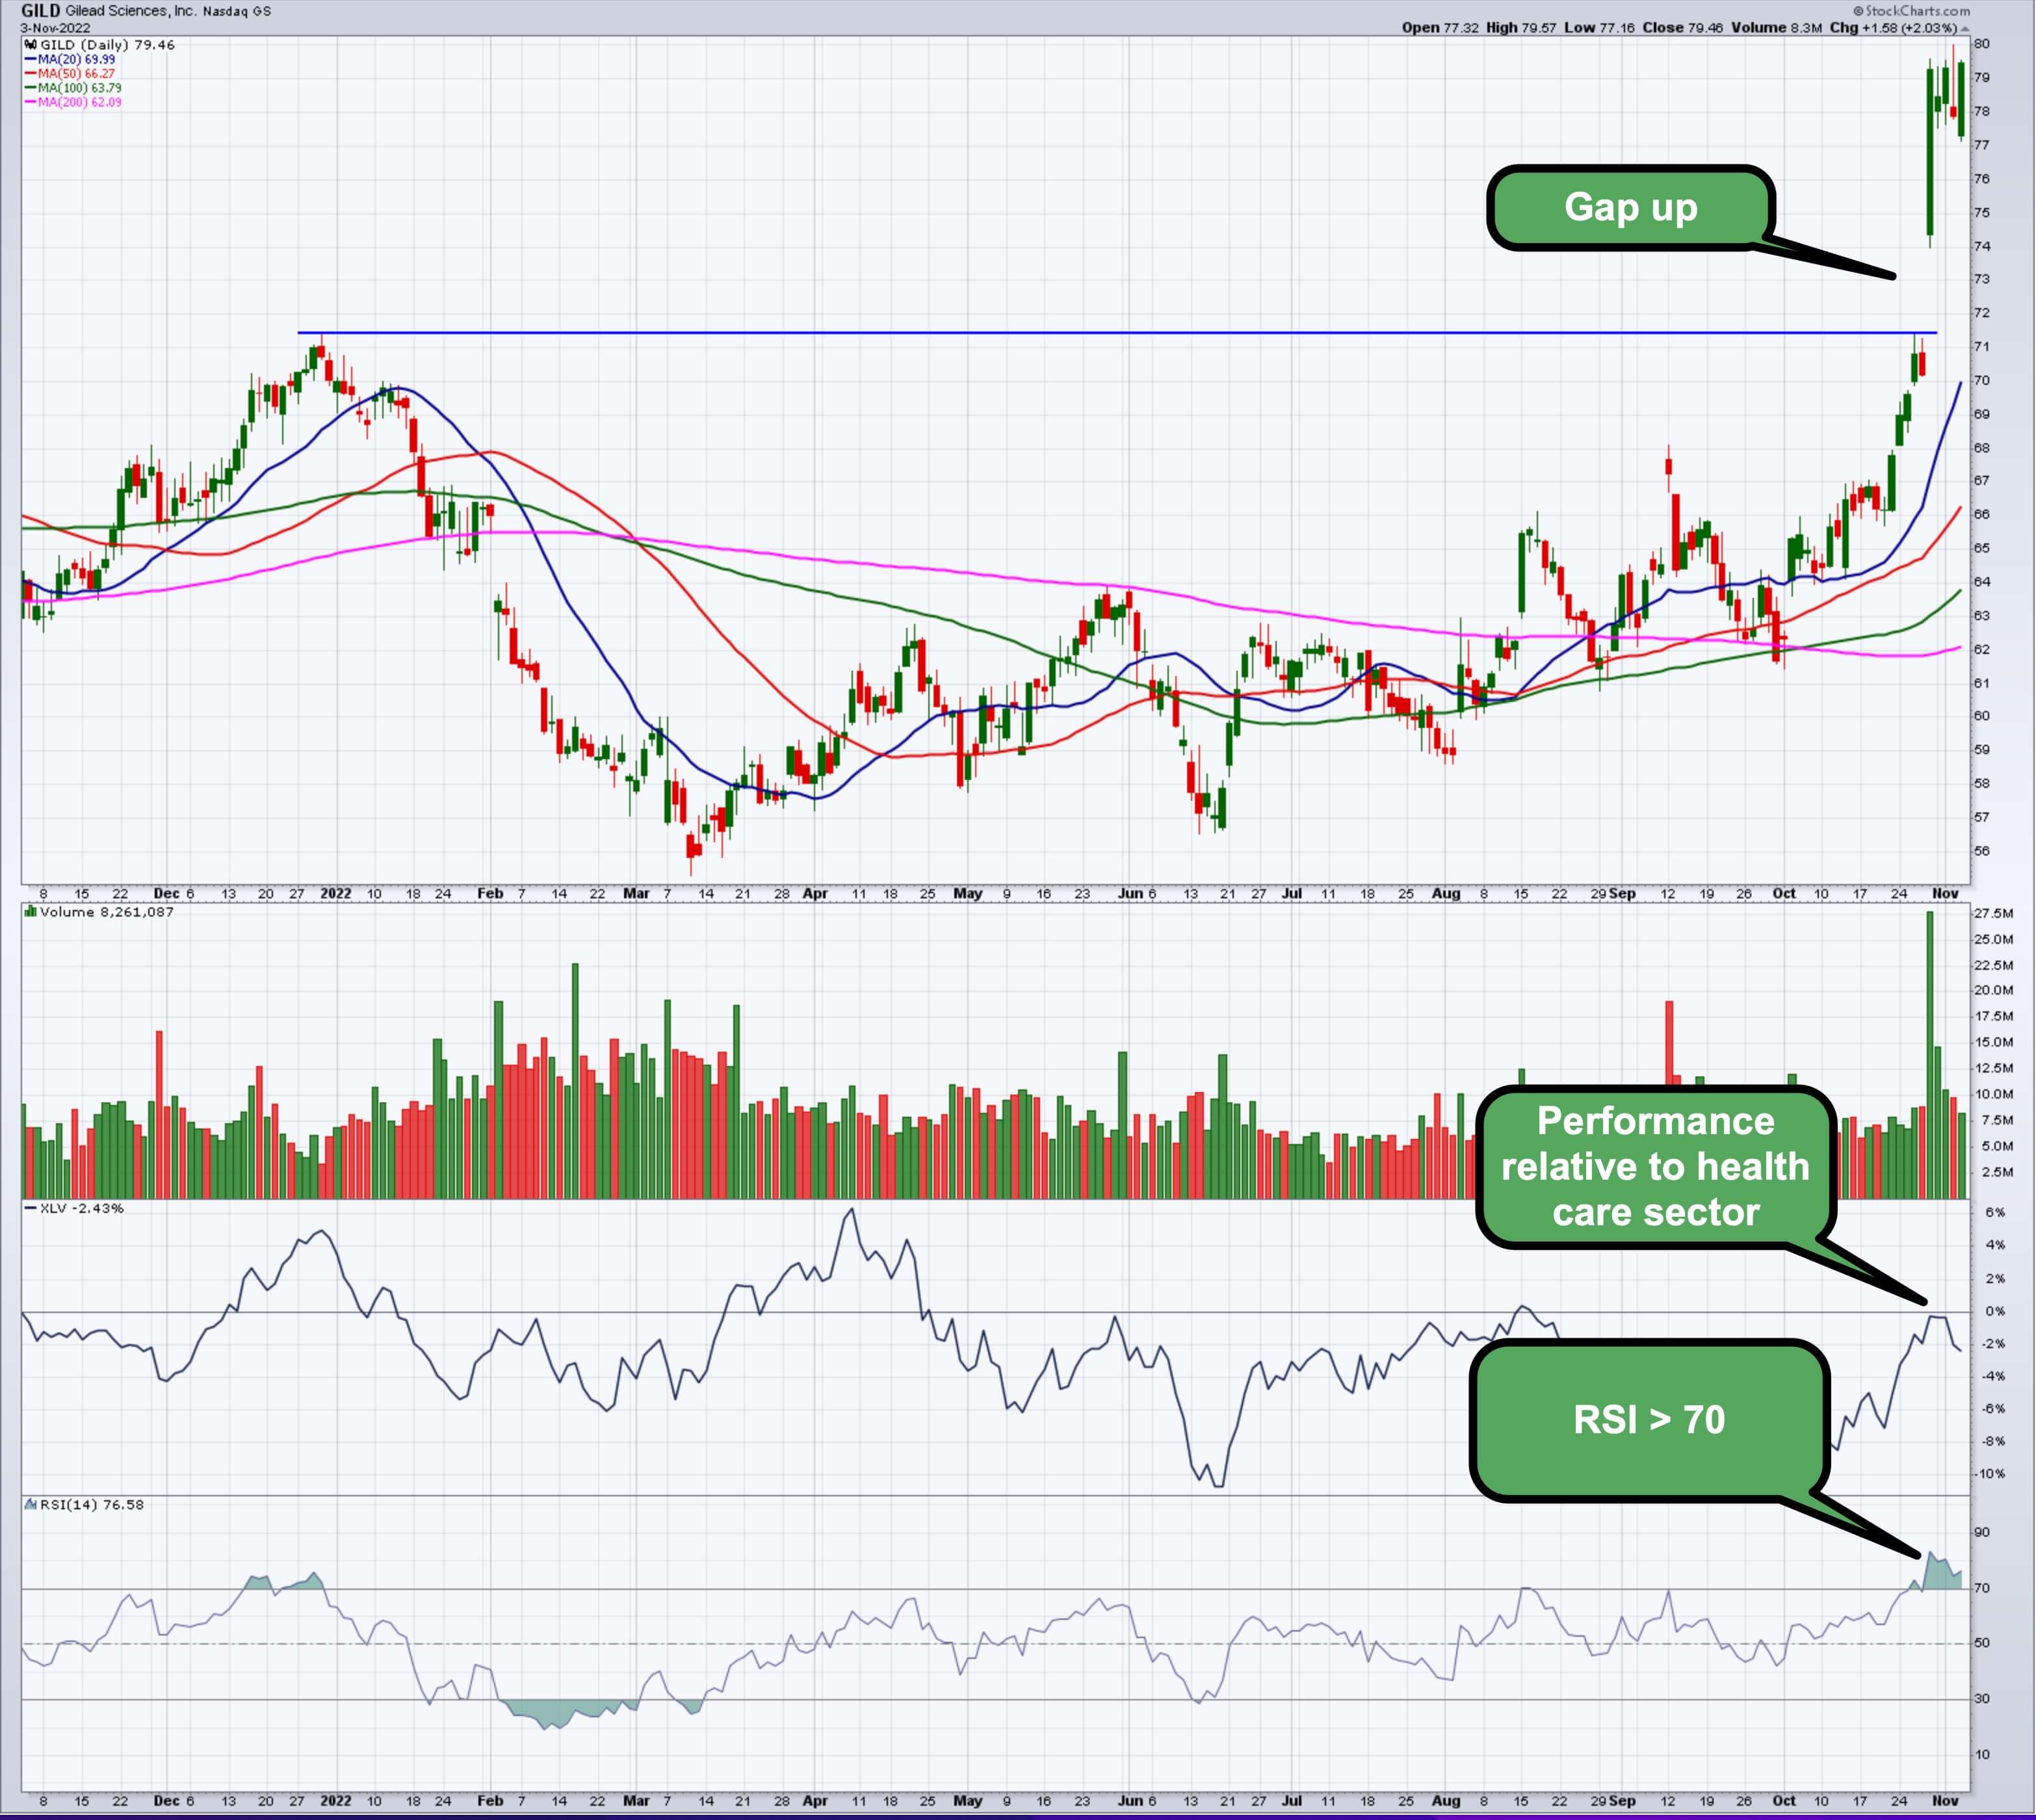
CHART 1: GILD STOCK MAY BE GLIDING HIGHER. GILD's strong earnings report saw the stock gap up and reach a 52-week high. The stock pulled back slightly but looks to be moving higher. It may be worth adding GILD stock to your ChartLists. Chart source: ACP from StockCharts.com. For illustrative purposes only.
What's GILD Got Going For It?
After several years of relatively sideways trading, GILD finally saw a spark of excitement. It's got a few things going for it.
- The stock is slightly underperforming relative to the Healthcare sector (using Health Care Select Sector SPDR Fund (XLV) as a proxy). It rose for a brief period, but went below the zero line.
- The relative strength index (RSI) is still above 70.
- The stock is trending above its 20-, 50-, 100-, and 200-day simple moving averages (SMA). The 200-day SMA has flattened out but looks like it may be starting to move up. The 20-, 50-, and 100-day SMAs are all trending higher.
GILD hit a 52-week high on the earnings news. Will that prove to be a strong resistance level?
From Symbol Summary, you can see that GILD hit an all-time high of $96.30 (adjusted) in 2015, so there could be some upside room for the stock. The 2023 guidance from the recent earnings call could give GILD stock a push in that upward direction.
However, there's always the possibility of the stock moving lower. A lot will depend on the strength of the broader market or of company and/or sector events. If either of these work against GILD, the gap up could get filled and the stock could head back towards the $56-$66 levels.
When remdesivir was developed, GILD stock saw some upside momentum reaching a high of around $86. Now, the stock is riding on the strength of the company's HIV and cancer drugs. If the strength gains traction, it could send the stock price to the $86 level, which could be the next resistance level.
It may be worth adding GILD to your ChartLists. If you want to find more stocks that are moving above significant moving averages, set up a scan to identify such charts.
How to Set Up a Scan in StockCharts
- Login to your StockCharts account
- From Your Dashboard, select Advanced Scan Workbench
- Start creating your scan. If you need help, scroll to the bottom and select Writing Scans.
Get started creating daily scan routines using StockCharts
Disclaimer: This blog is for educational purposes only and should not be construed as financial advice. The ideas and strategies should never be used without first assessing your own personal and financial situation, or without consulting a financial professional.
Happy charting!


