Tech stocks, once the favorite among investors, seem to be losing some of their bling. Since the middle of earnings season, investors seem to be shifting towards the more non-glamorous materials and industrial stocks. Take a quick view of charts of the three broader indexes—Dow Jones Industrial Average ($INDU), S&P 500 Index ($SPX), and Nasdaq Composite ($COMPQ)—and you'll see that, of the three, $INDU is the top performer.
One popular industrial stock that's been gaining attention is Boeing Co. (BA), which is one of the top 10 holdings in the Industrial Select Sector SPDR Fund (XLI).
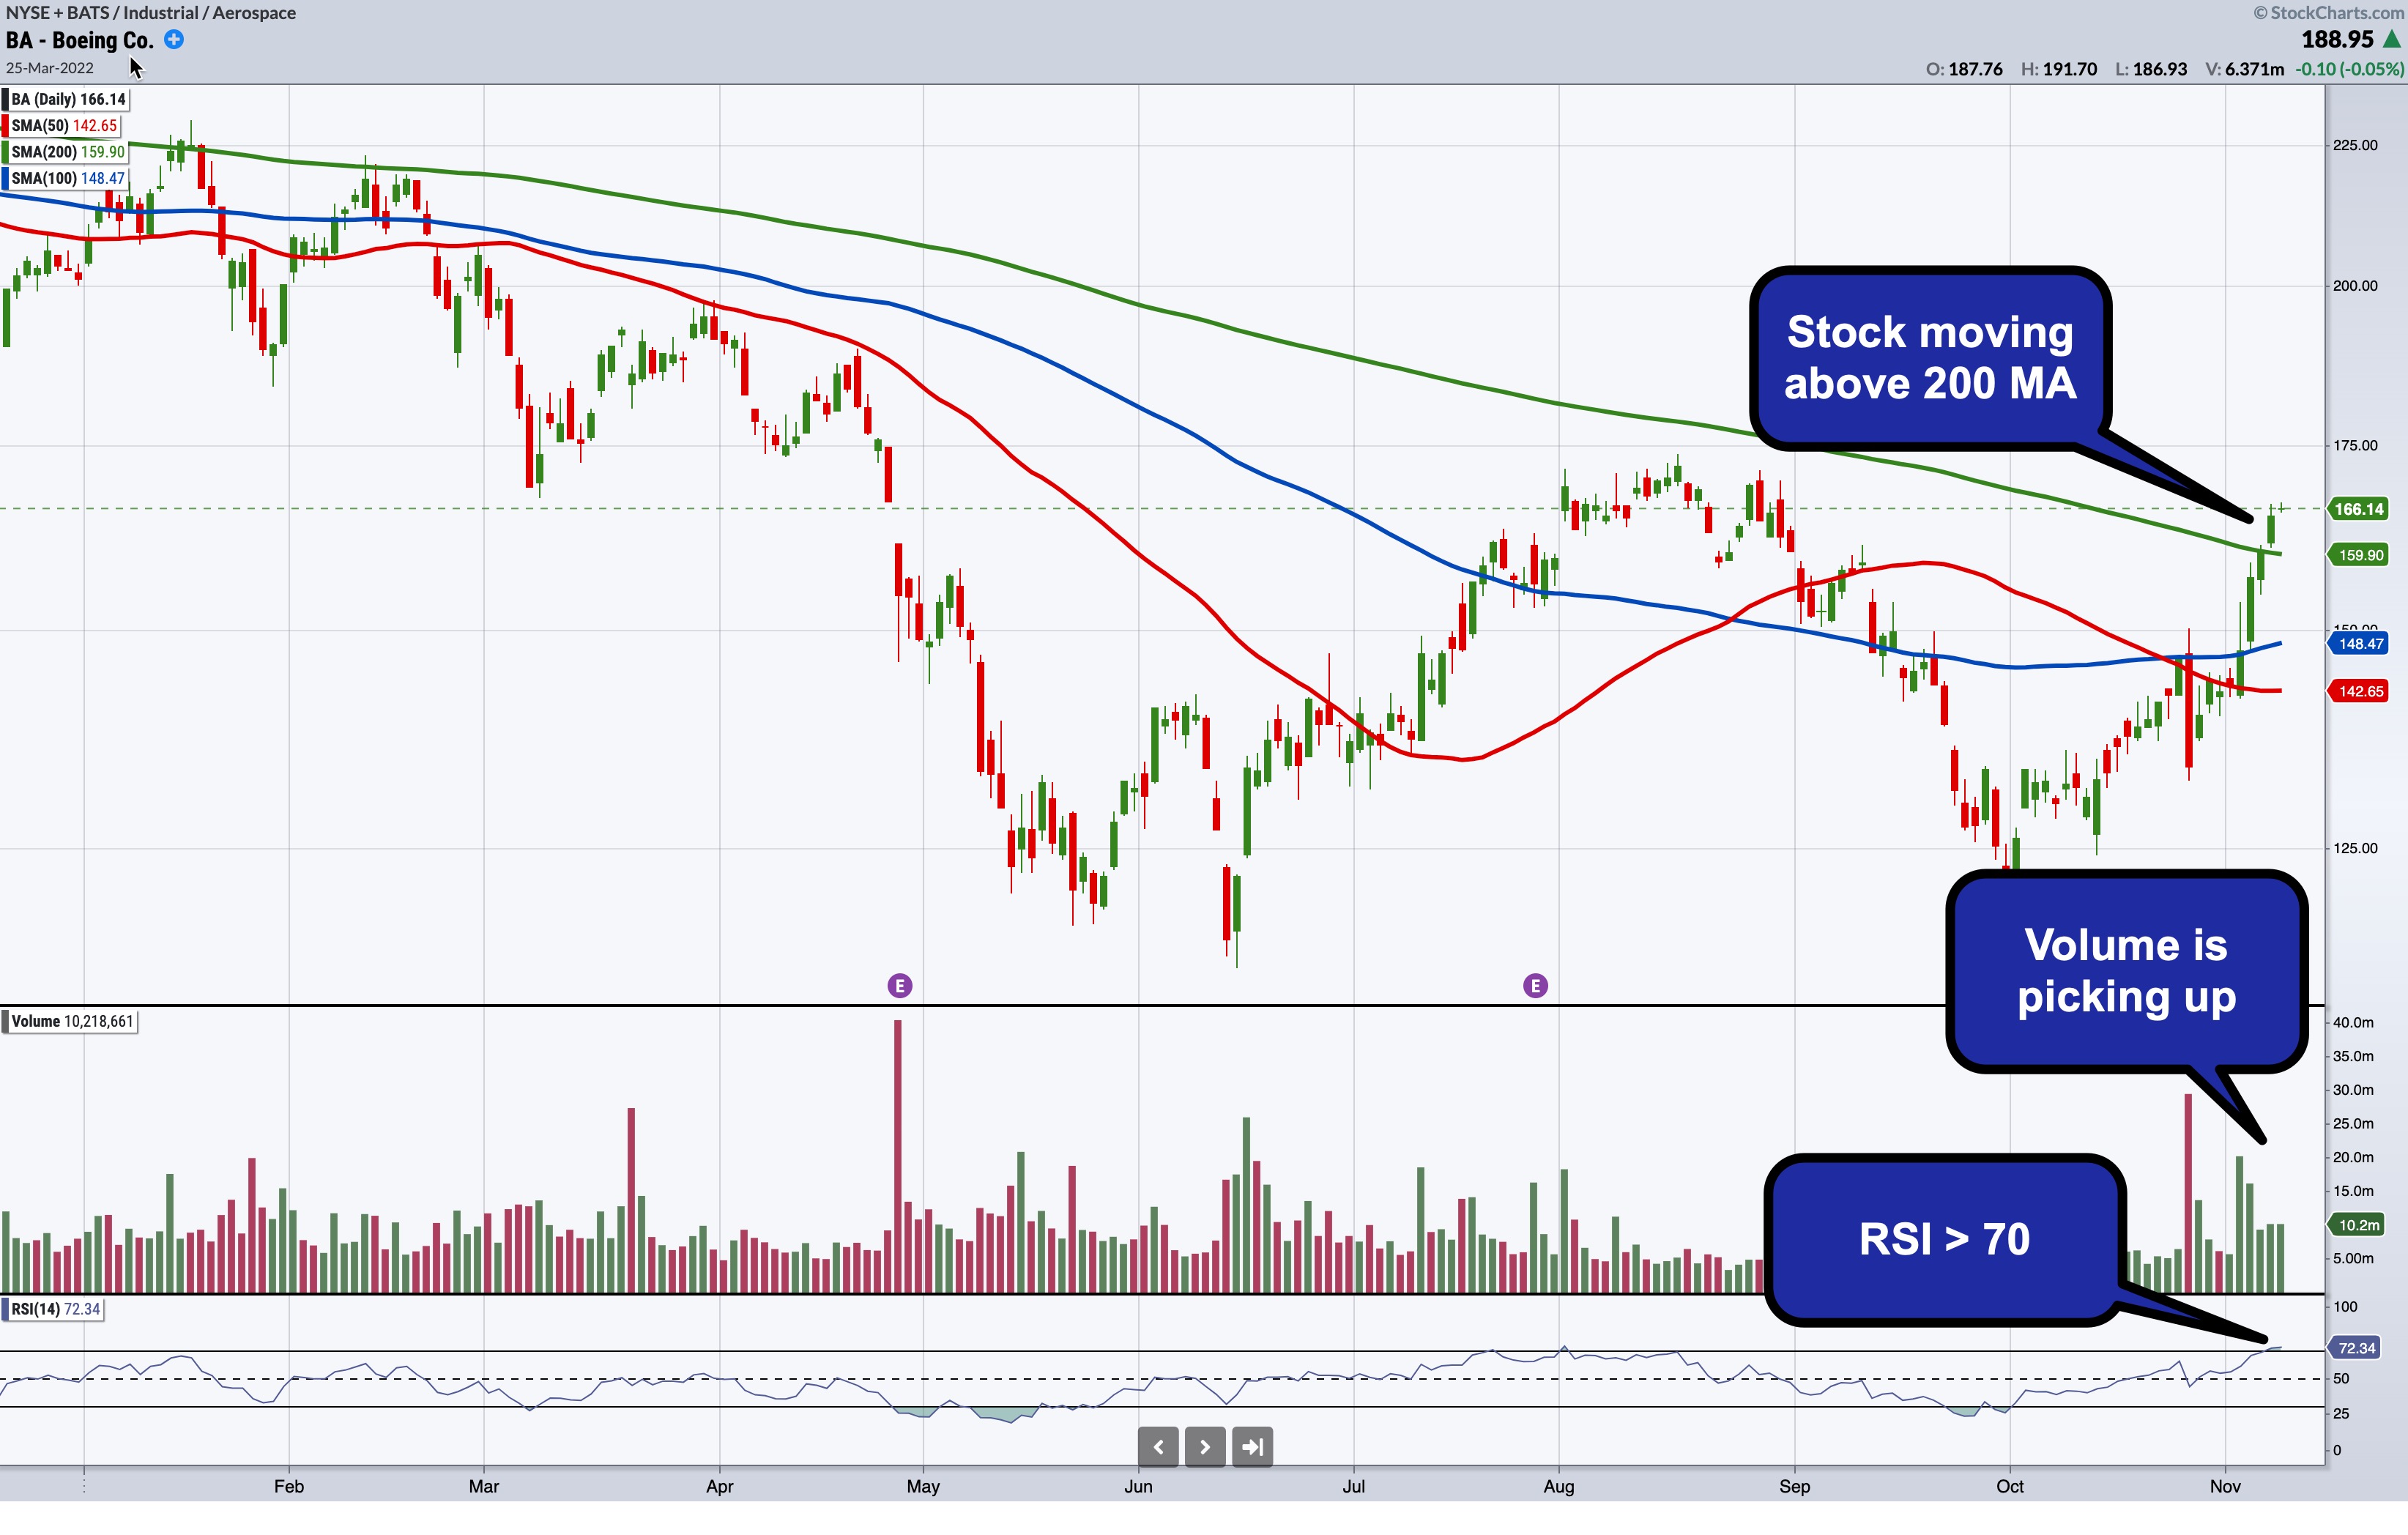
CHART 1: BOEING STOCK MAY HAVE SOME UPSIDE. The stock price may be poised for a breakout. Keep an eye on volume and the RSI.
Chart source: ACP from StockCharts.com
BA stock has struggled for several years. The latest disappointing earnings results didn't help either. But things look like they may be turning in BA's favor after an analyst event the company hosted last week. The company expects to see an increase in its cash flow in the next few years, and the overall guidance from the company's management team provided a shinier future. We may be seeing signs of this in the stock price action.
What's BA Stock Got Going For It?
The company has seen its share of bad news. Its 737 MAX jets were grounded for almost two years and the challenges of COVID-19 were both strong headwinds for the aircraft manufacturer. But change may be on the radar.
- The stock has seen four consecutive up days. Investors seem to be attracted to the stock given that trading volume has increased during those four days.
- The stock price has moved above its 200-day simple moving average (SMA), which is still trending down. If we see the 200-day SMA start to flatten out and trend up, it could paint a more positive scenario.
- The relative strength index (RSI) is above 70, which is the overbought threshold. The RSI could continue to remain above 70 if the stock price rises.
The good news from the analyst event, the technicals, and an increase in demand for aircraft may help the stock recover. BA's recent price action makes it an ideal candidate to add to your StockCharts ChartLists. Let's see if the stock does indeed take off and remain aloft.
Explore how to apply the relative strength index (RSI) to your chart analysis and trading.
Disclaimer:
This blog is for educational purposes only and should not be construed as financial advice. The ideas and strategies should never be used without first assessing your own personal and financial situation, or without consulting a financial professional.
Happy charting!