After hitting a high of around $176 in November 2021, the e-commerce platform Shopify, Inc. (SHOP) saw its stock price fall to a low of $23.63 within the span of a year. During the COVID-19 pandemic, SHOP attracted a lot of sellers, since many transitioned to offering their goods and services online. But after the economy started to reopen and people started shopping IRL again, SHOP saw a slowdown in its growth.
So, it was nice to see the stock get attention. SHOP showed up on the top of the StockCharts SCTR Reports in the Top Up, Large Cap category.
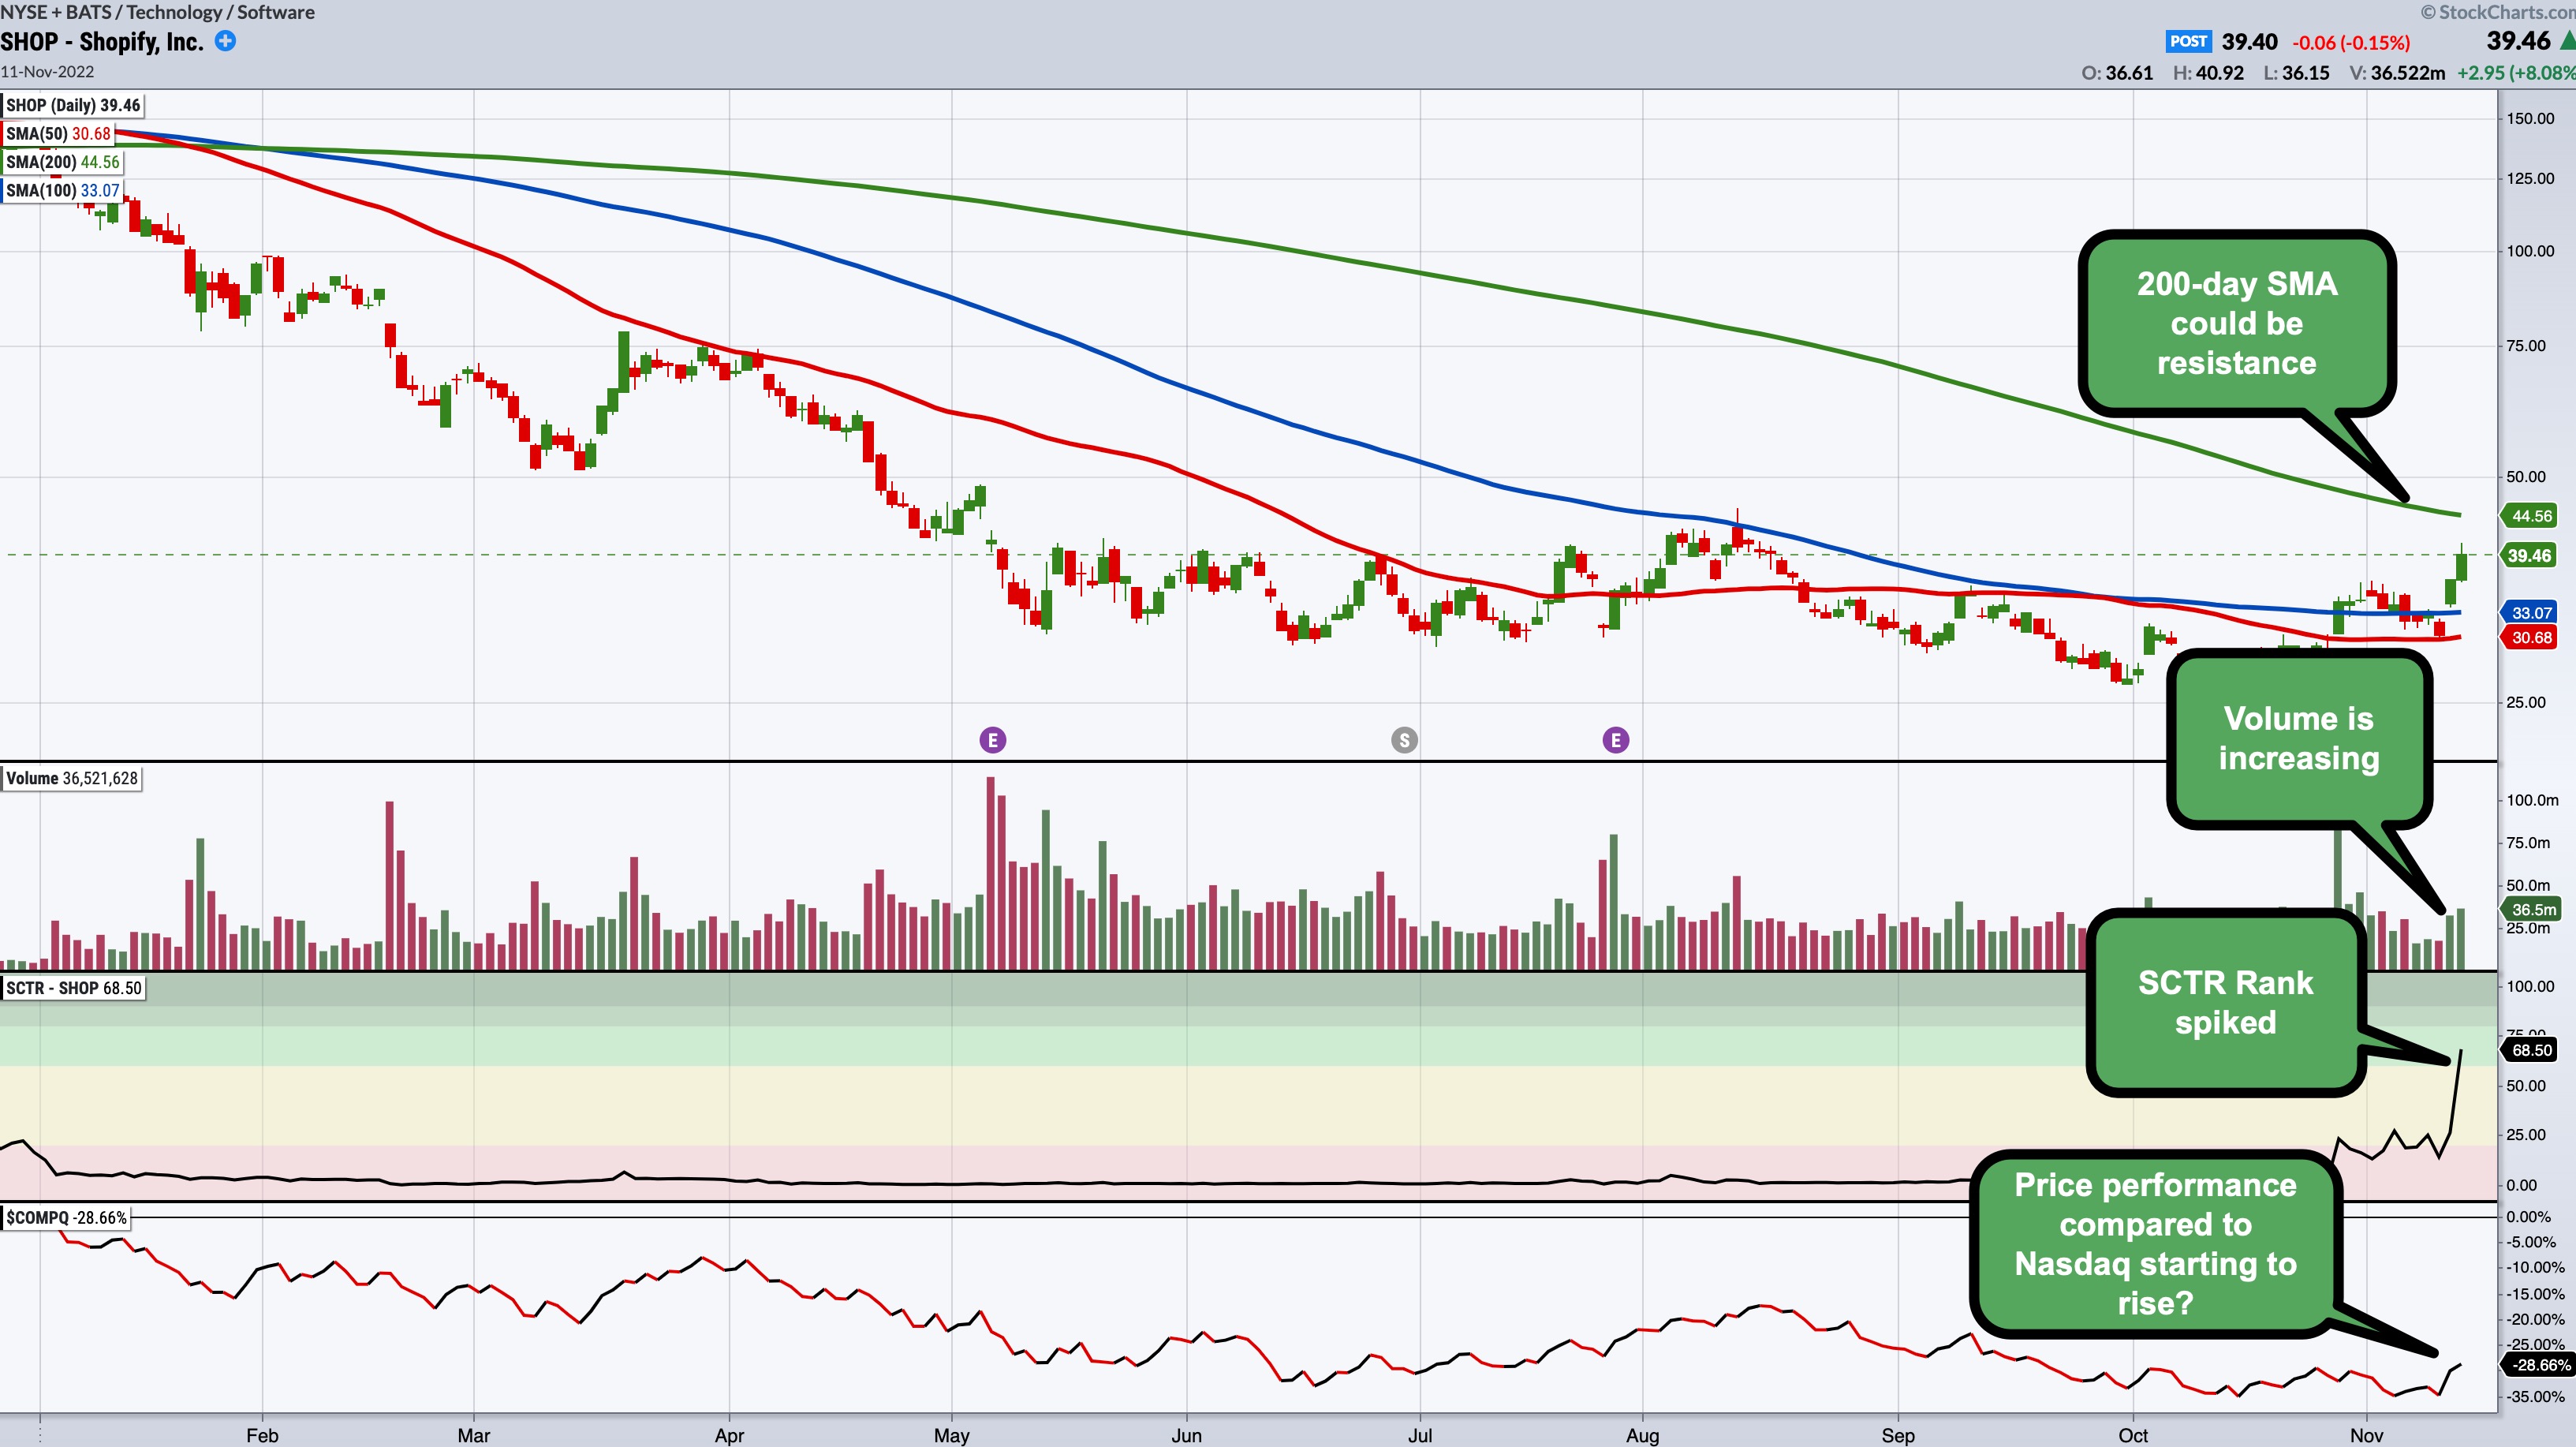
Chart source: StockChartsACP from StockCharts.com. For illustrative purposes only.
The company reported better-than-expected Q3 earnings, which may have helped the stock price gain some momentum. But, in addition to the earnings, the chart of SHOP has a few things going for it:
- The stock is trading above its 50- and 100-day simple moving average (SMA) on rising volume. It could face resistance at the 200-day SMA, which would be a level to watch.
- The SCTR Rank (the SCTR Line is an indicator available on StockChartsACP) spiked from around 13 to just below 70.
- SHOP's price performance compared to the Nasdaq Composite ($COMPQ) is starting to show signs of increasing, although it should still be a little higher than it is now. Then again, technology stocks have taken a beating of late and are now looking like they are gaining favor.
The Takeaway
It's worth adding SHOP to your ChartList, but the price action needs to follow through a bit more than where it is. It may be riding up with the Technology sector, which may be gaining some ground, especially after Thursday's CPI number. Any evidence the company is riding on its own strength, either technically or fundamentally, would make it even more lovable.
Jayanthi Gopalakrishnan
Director, Site Content
StockCharts.com
Happy charting!