Semiconductors are getting a lot of love from Wall Street once again, with many stocks in the industry getting upgrades from analysts. No wonder many of the semiconductor stocks spiked higher. All you have to do is pull up a chart of the iShares Semiconductor ETF (SOXX) and you'll see how the stocks in the industry have been performing. Stocks like Nvidia (NVDA), Advanced Micro Devices (AMD), Taiwan Semiconductor (TSM), and Micron Technology (MU) are all rallying sharply today (January 23, 2023). But after their big move, how much more upside momentum do semiconductors still have?
We'll look at the daily chart of NVDA (see below) as an example. From a technical perspective, some key points rise to the surface.
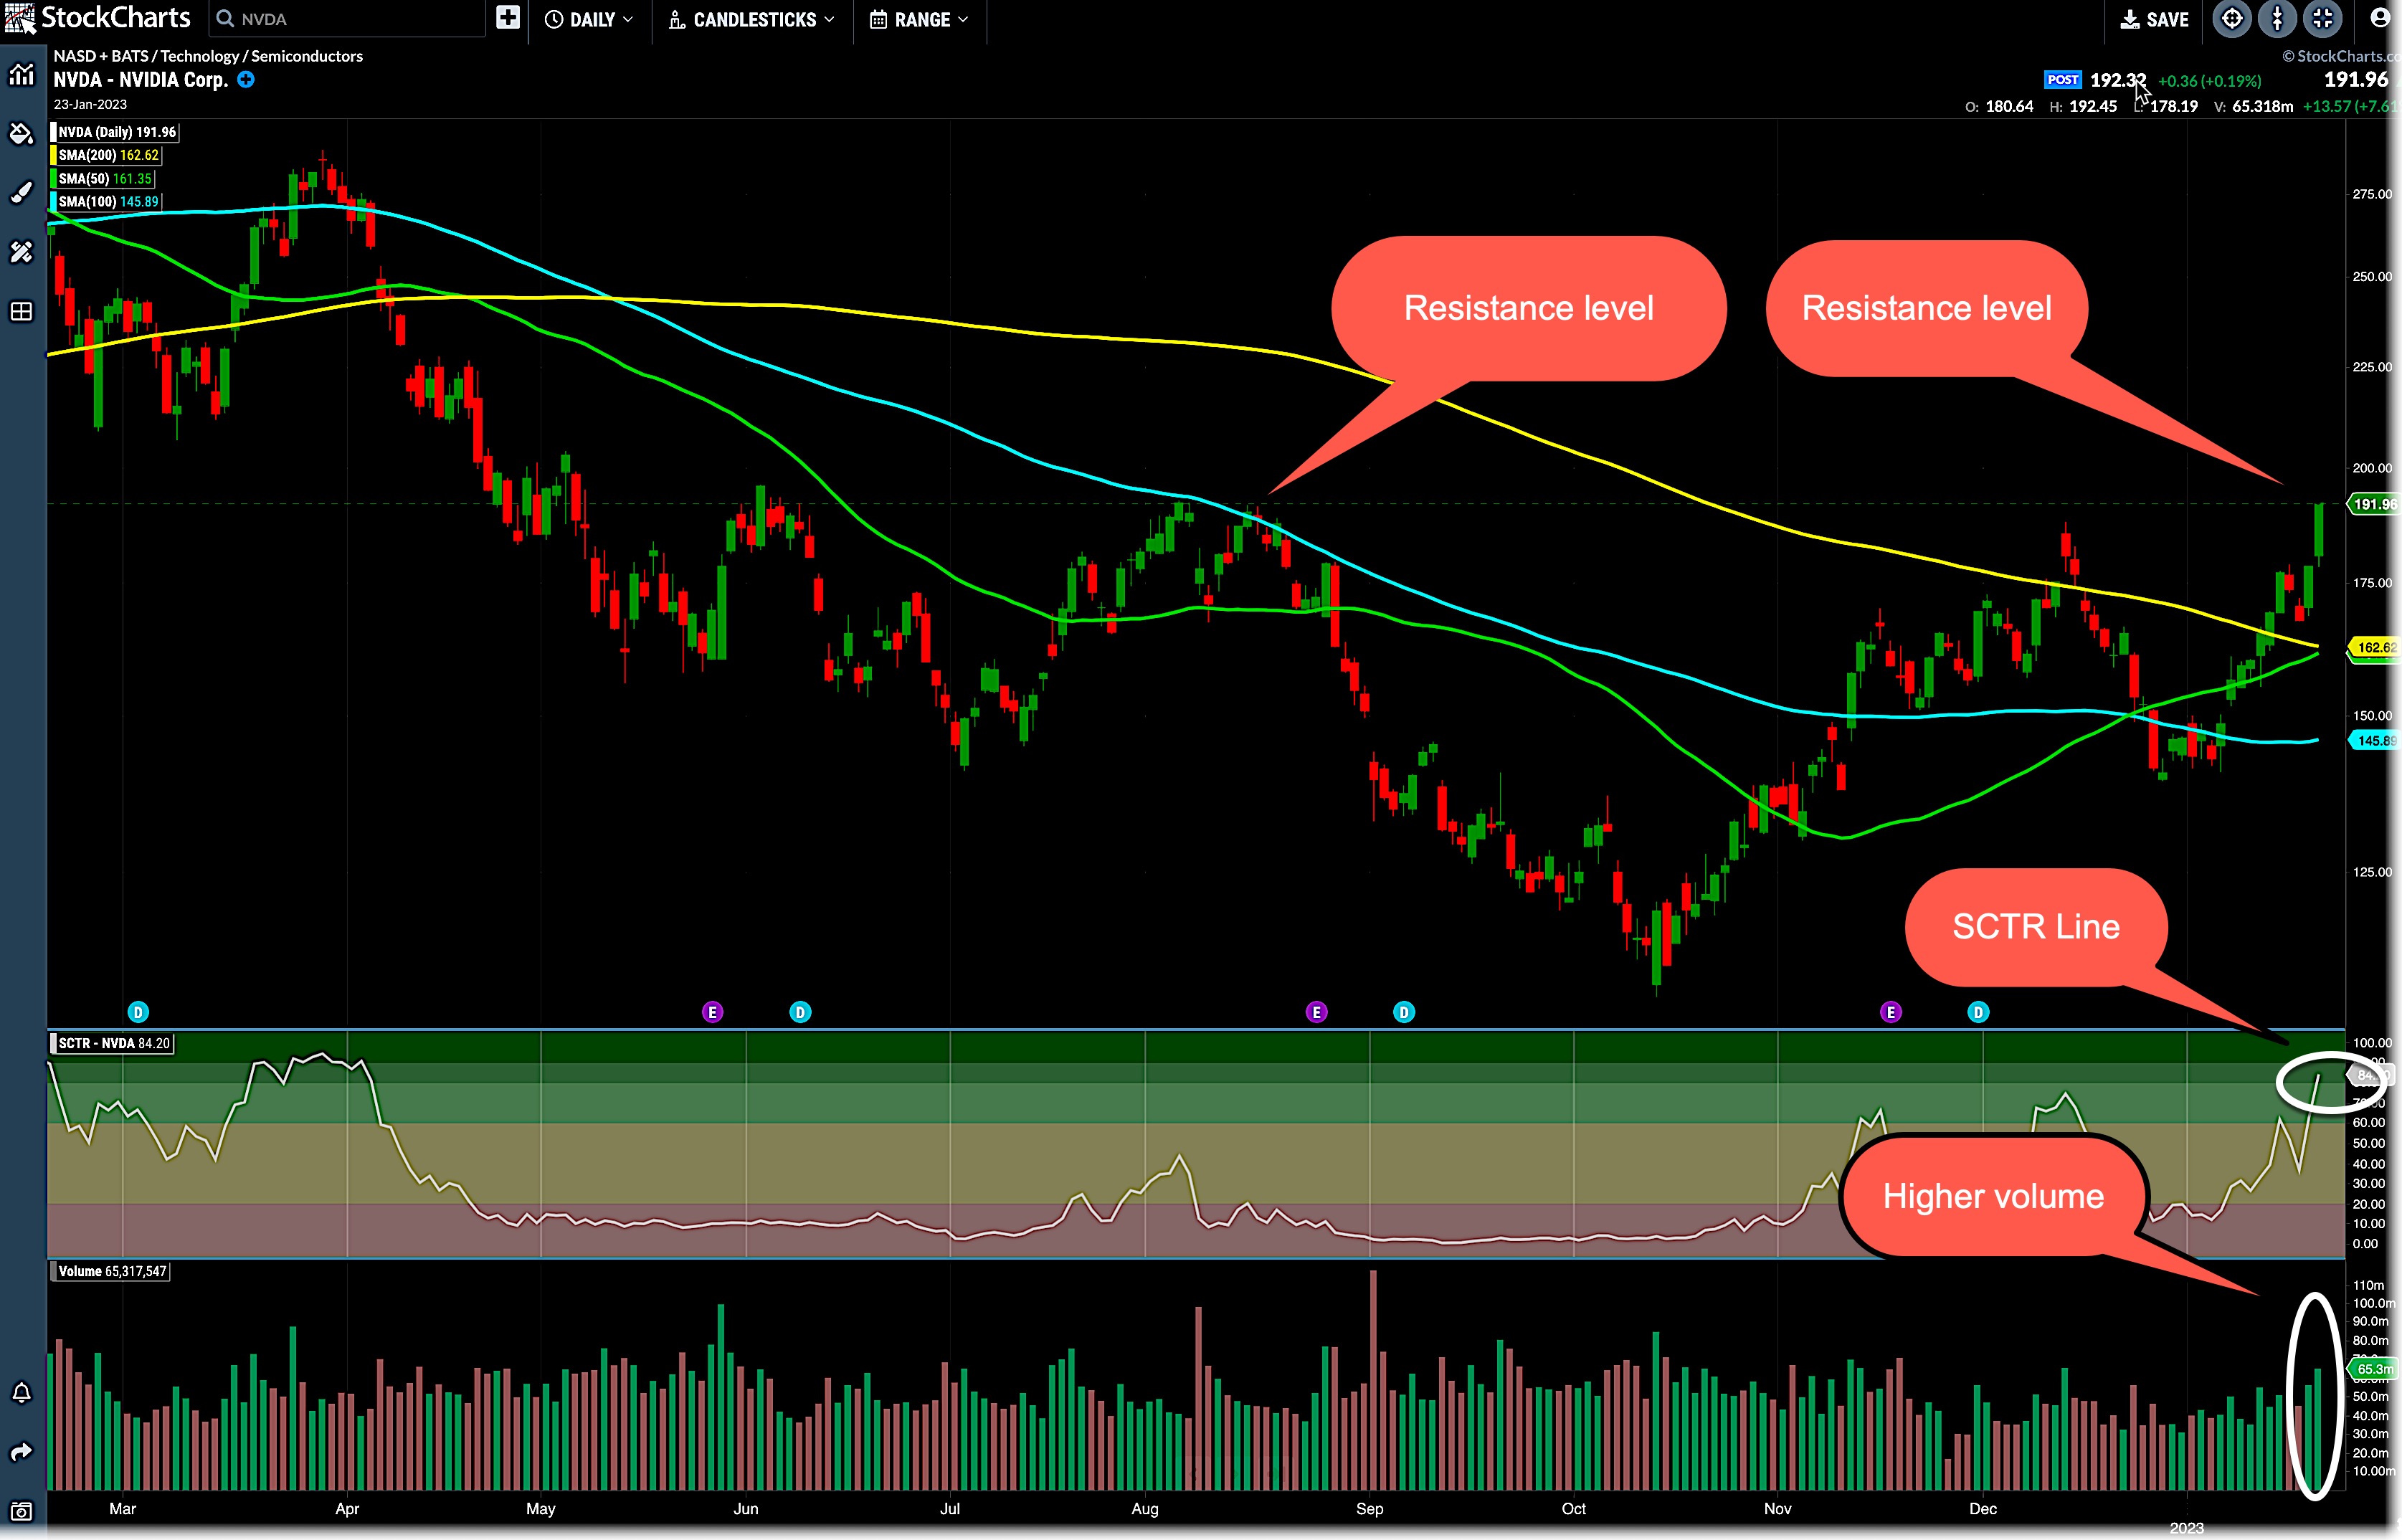
CHART 1: NVDA STOCK CHART ANALYSIS. The stock is trading above its 200-day moving average, the SCTR line is trending higher, and volume is also trending higher. But the stock is hitting a resistance level. Will it pull back, or break above the resistance level and move higher?Chart source: StockChartsACP. For educational purposes only.
Is NVDA a Buy?
- The stock price is above its 50-, 100-, and 200-day moving averages (MAs).
- NVDA's stock price is testing a significant resistance level at around $192. If you look back to August 2022, you'll notice that the stock price hit this level twice before it traded lower. On August 15, 2022, the stock bounced off the $192 level and declined lower to its October 2022 low. Since then, NVDA's stock price has moved higher. It's now back at that important resistance level. Will the stock price break above it, or will it pull back?
- The SCTR line is at a respectable 84 level and looking like it could trend higher.
- Trading volume on up days is higher than average.
In light of the above points, a pullback in the stock's price is possible. If one does occur, it may be a good buying opportunity. If the stock continues higher, breaks above the $192 level, and follows through, you could place a buy order with a stop at around $192.
The next resistance for NVDA's stock price is at around $200. A breakout above that could take it to the $230 level, then $290, after which it would be at around $340, its all-time high. The stock has the potential to move higher, like many other stocks that were beaten down, but watch the MAs. The 50-day MA could act as a support level on a pullback. Also, keep an eye on the 200-day MA, which is still sloped lower. It would have to slope higher to confirm a bullish trend in the stock.
There is a lot of optimism in the stock market, but, while it's nice to see your trades do well, never take anything for granted. If you are considering trading NVDA, remember to add the chart to one of your ChartLists and set alerts for the different support and resistance levels you see on the chart. That way, you'll be alerted to the key entry and exit levels, which will make you a more informed trader.
Happy charting!