2022 was a year that required a ton of patience, waiting out the cyclical bear market that unfolded, especially during the first five to six months of the year. But we saw significant strength in many areas during Q4, and growth stocks have powered the market forward in January 2023. January's performance has long provided many clues about "balance of year" performance (February through December) with amazingly accuracy. Consider that, of the top 20 Januarys since 1950, which requires January performance above roughly 4%, 18 "balance of year" returns have been positive, and 14 have shown gains of at least 10%. Now let's compare the Bottom 20 Januarys, which all produced monthly losses of 2.5% or more. The "balance of year" performance saw gains in just 13 of 20 years. Only 6 of 20 saw "balance of year" gains greater than 10%. January performance is positively correlated with "balance of year" performance.
So let's look at the current SPDR S&P 500 ETF (SPY) chart performance and technical outlook.
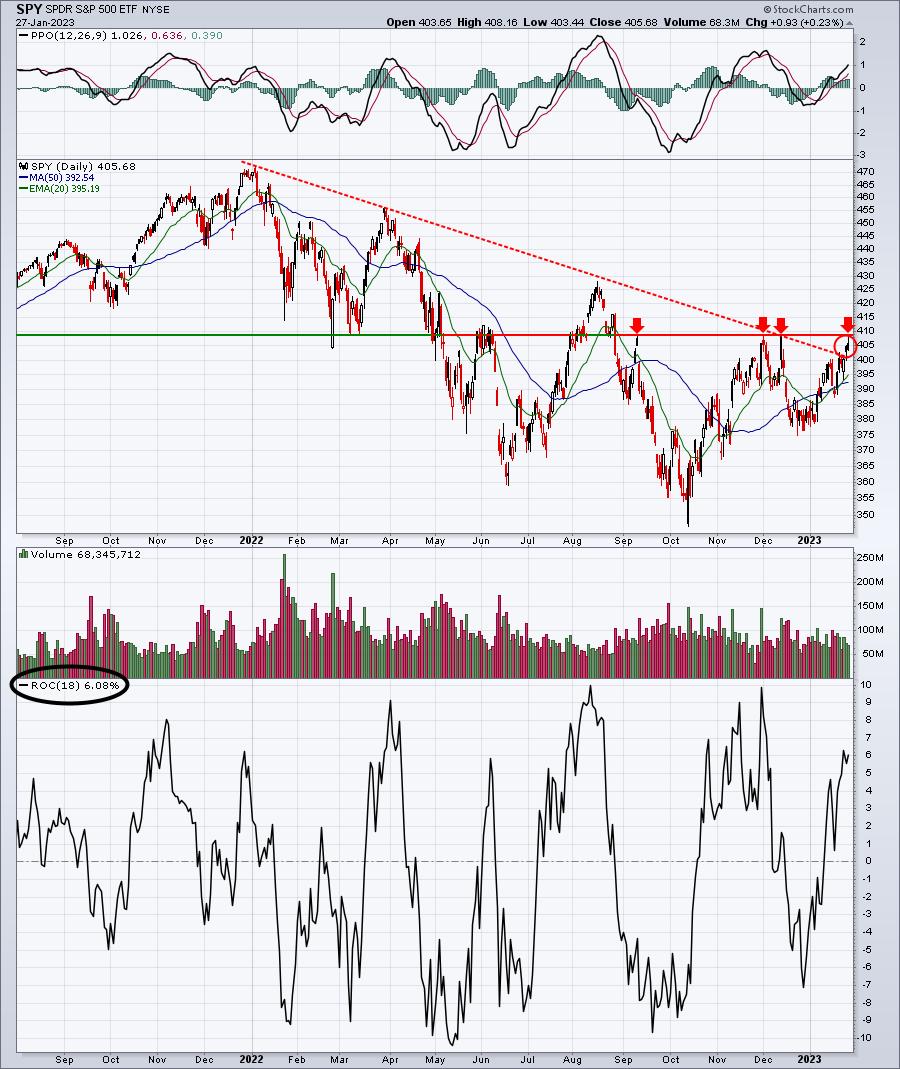
The bottom panel represents the 18-day rate of change (ROC). We've had 18 trading days in 2023 thus far, which gives us our January-to-date performance. The January 2023 6.08% gain, if it holds up through January 31, would be the tenth-best January since 1950, placing it easily within the Top 20 Januarys over the past 73 years. When looking at nothing but the price trend, I think it's important to clear the downtrend that's been in place since early 2022. I also believe it's important to clear recent price highs in the 400-410 area. Friday's high was 408.16. The downtrend line has been broken, but we still need to see price resistance eclipsed near 410. That will be the bulls' primary goal this week.
As action has turned much more bullish in 2023, we've seen renewed buying in stocks that are heavily shorted. I wrote about Wayfair (W) last Sunday after it broke out above price resistance in the 42-43 range. Wayfair gained more than 36% last week, as a large number of short sellers (short % of float is currently reported near 35%) ran for cover.
Tomorrow morning, I'll be unveiling a stock with nearly 40% of its float short that just broke out on Friday in a pattern quite similar to W. I believe it has the potential for a significant rally in the week ahead. You can CLICK HERE if you're not already a FREE EB Digest subscriber. Simply enter your name and email address and I'll send you that short squeeze stock around 8:30am ET. There is no credit card required, and you may unsubscribe at any time.
Happy trading!
Tom


