When traders and investors brave the heights of speculative endeavor, clear conditions, fundamentally and technically, are the most you could ask for. But there are cases where fundamentals remain foggy and technical chart patterns seem almost hidden or questionable. This is certainly the case with Boeing (BA), as it took flight with a bullish ascending triangle pattern amid a loss-ridden yet not-too-disappointing earnings report.
Long-term guidance hints at growth and optimistic expectations, yet Wall Street knows that economic winds often play a strong hand in shifting Boeing's market.
Are they tailwinds or headwinds? Try both.
An Ascending Triangle Amid Some Technical Turbulence
As every trader knows, patterns are not always cookie-cutter clear. The collective drive that causes formations to occur matters, and the variations in conviction will often reflect the variations in the shape of technical formations.
The Tailwinds for Boeing Stock
A couple of bullish indications are at play. Let's take a closer look at Boeing stock (see the chart below).
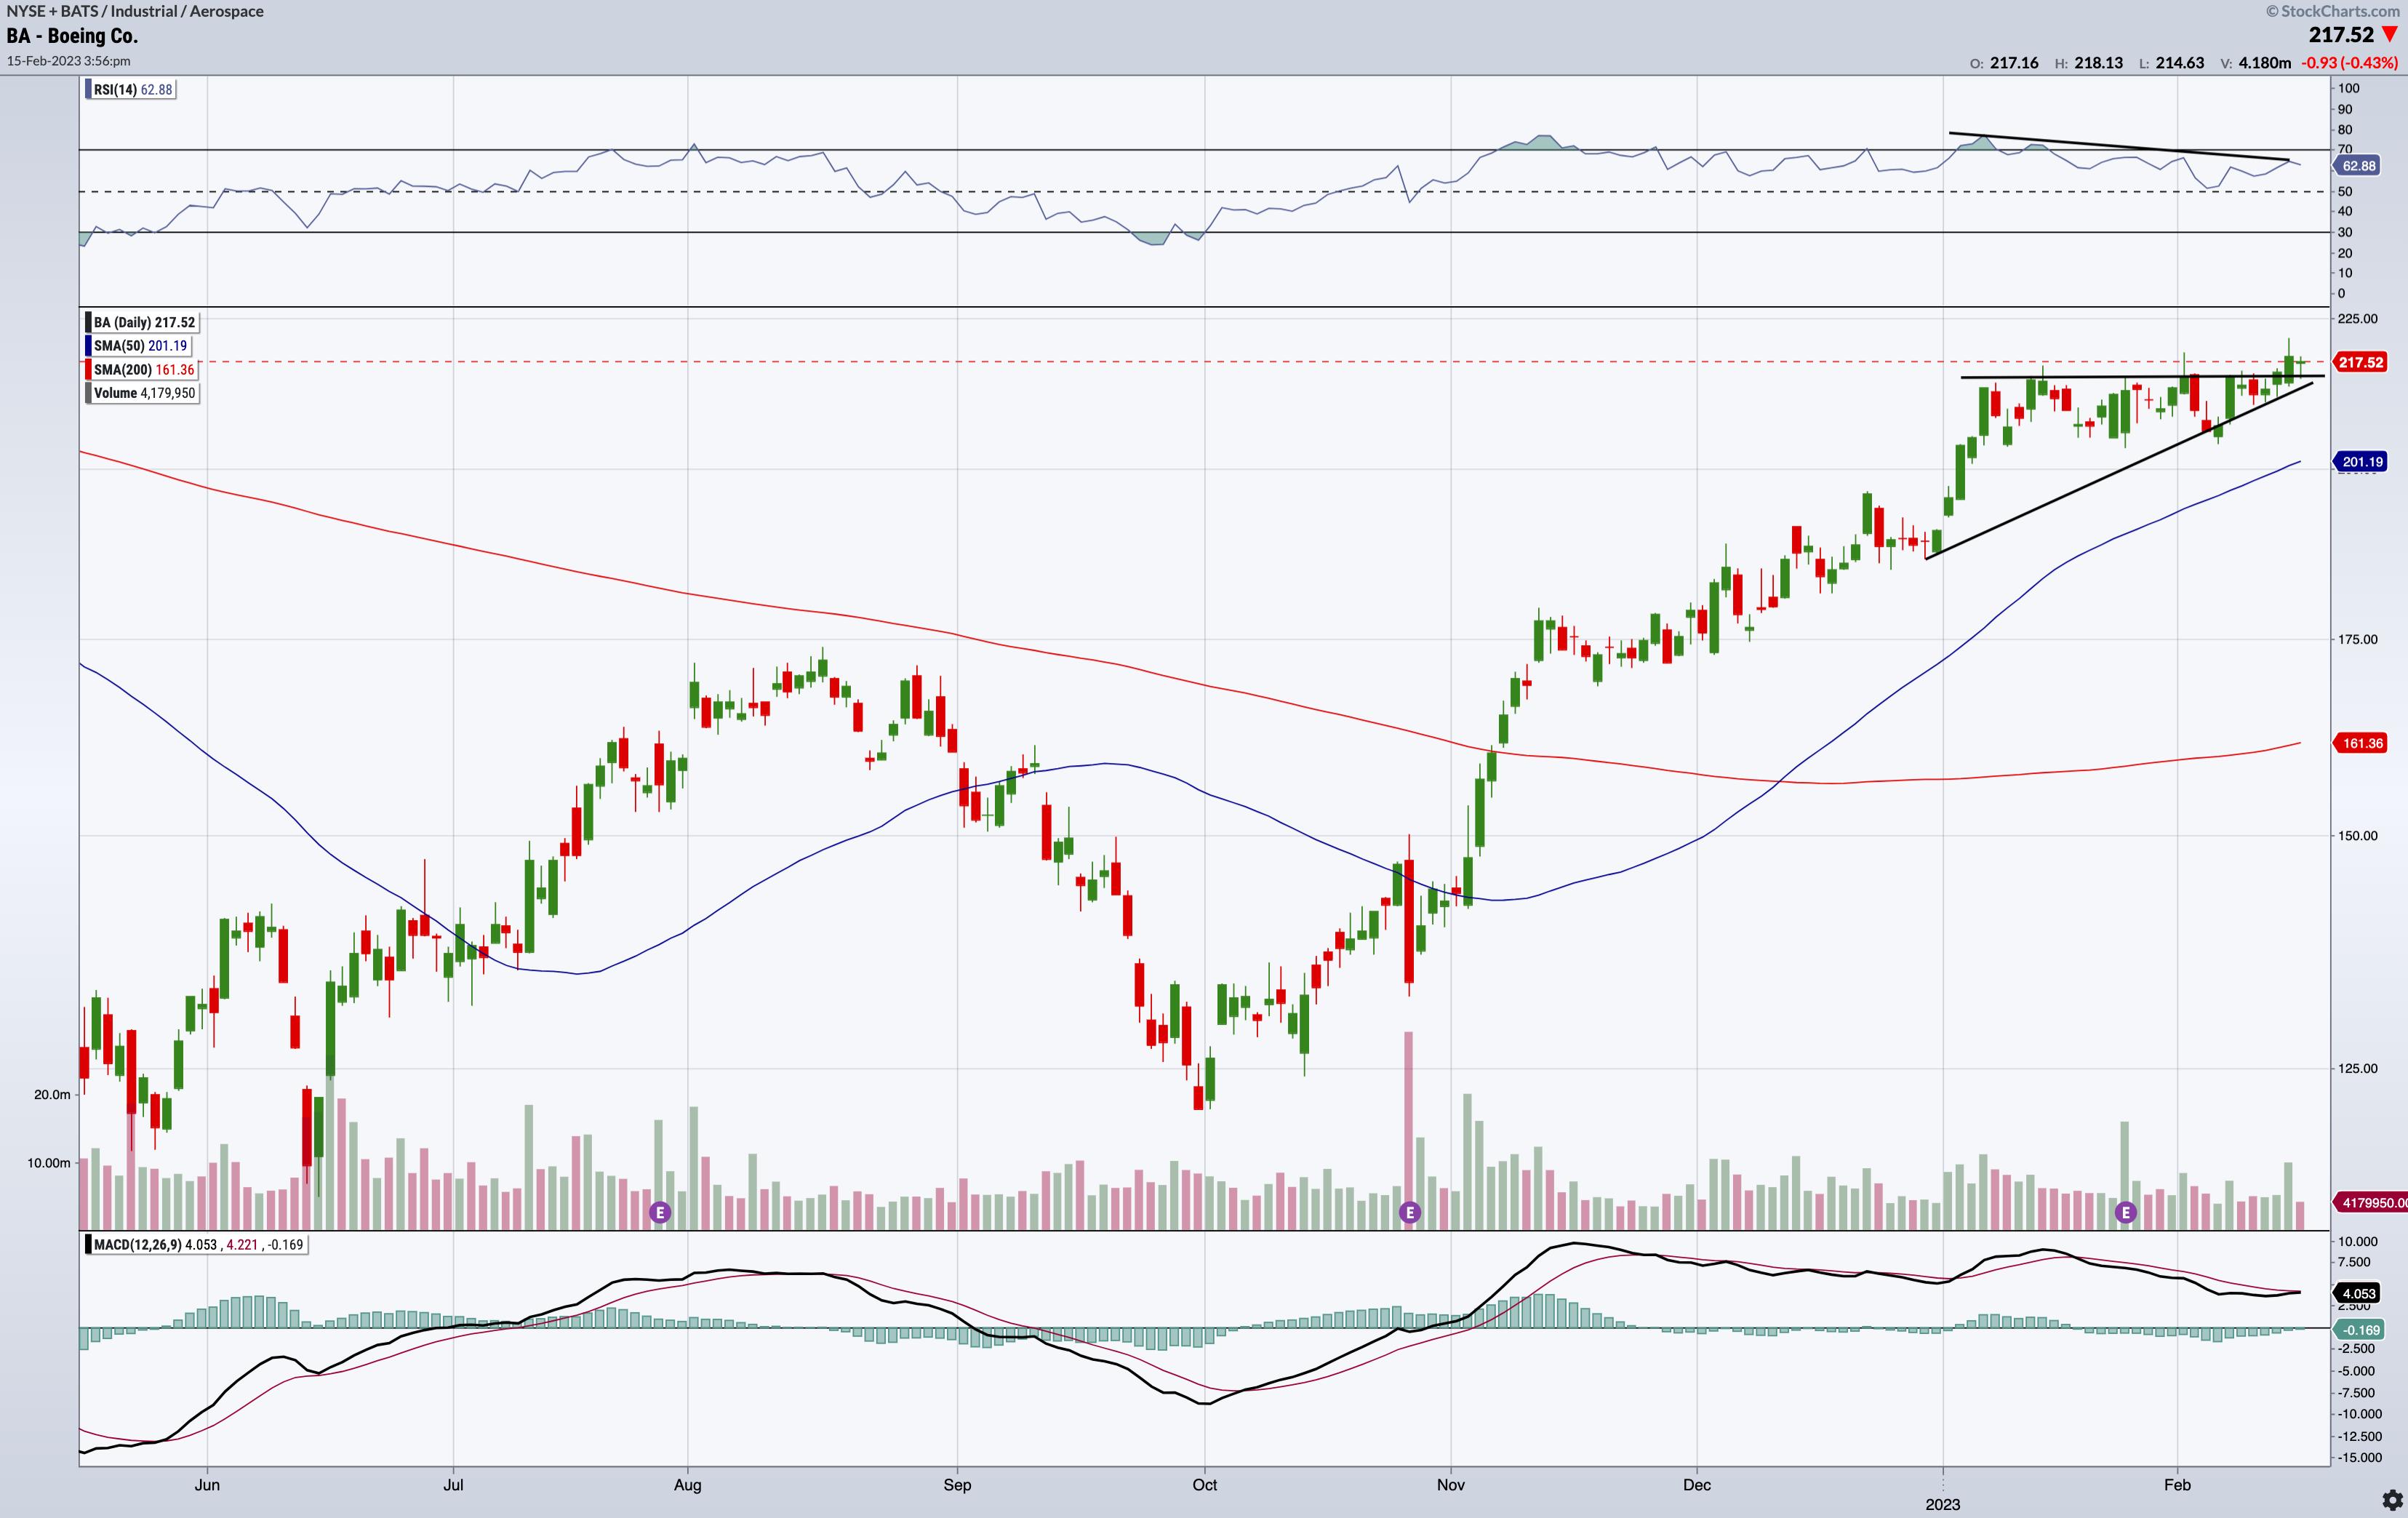
CHART 1: BOEING STOCK. Boeing's stock price could break above the ascending triangle and continue the bullish rally that started in October. Look for a follow-through on higher-than-average volume and for the MACD line to cross above its signal line.Chart source: StockChartsACP. For illustrative purposes only.
An ascending triangle. Boeing's ascending triangle appears to form a bullish continuation pattern of the current upswing that began in October.
Now, bear in mind that when it comes to identifying ascending triangles, the bottom formation is critical (as that's what's actually "ascending"). We see an ascending set of consecutive lows, but you have to bear in mind that lows are conditional to trending movements, and there are often many trends (smaller or larger) within a single trend (which is why you can draw different trendlines to trace larger or smaller swings).
What prompted the breakout in Boeing's stock price on February 14? A massive Air India order requesting 220 Boeing jets (190 737 Max planes, 20 787 Dreamliners, and 10 Boeing 777X).
A Golden Cross occurred in mid-December. We can call this a Type 1 Golden Cross event, as the price was extended far beyond the price point in which the 50-day simple moving average (SMA) crossed above the 200-day SMA. A Golden Cross is typically considered a bullish signal, but you have to look at what you're flying into, especially if there may be turbulence ahead.
Headwinds for Boeing Stock Price
Despite the bullish momentum underwing, there are a few things to watch out for.
RSI — Gaining Altitude While Losing Fuel? If you compare the January 6 Relative Strength Index (RSI) reading against the February 14 RSI reading, you see a move from a 77.06 (overbought) level to 64.61. This spells two things—a slight decline and divergence. So, is price driving ahead of its momentum?
MACD — The Lines Looking Not-So-Good: Take a look at the MACD line on November 15 and January 13. Boeing's share price rose significantly, while the MACD line slid from 9.77 to 9.03. In both instances, the MACD line also crossed under the signal line (though it looks to be crossing over once again toward the upside). The MACD histogram currently holds a negative baseline reading. Sunny skies? Maybe, but you can't deny the thick screen of clouds ahead.
The Fundamental Picture Paints a Monochrome Gray
The pandemic hit aircraft manufacturing demand with a brutal blow to the gut. While demand has risen sharply since, many manufacturers, Boeing included, are hesitant to put the engines of production into full gear.
Boeing's Q4 2022 performance was better than expected, despite losses in earnings and revenue (again, another instance where not-so-bad = good). The company generated the most cash flow it's seen since 2018, when the MAX crashes triggered a yearlong tailspin. Yet the company has "a robust pipeline of development programs" looking forward, according to its CEO Dave Calhoun. And the Air India orders (among any forthcoming sales) may exert some weight on the coming quarter's earnings report.
The Bottom Line
There are several technical and fundamental factors to consider, especially if Boeing's stock price breaks out (or breaks down) from the current ascending triangle pattern. If you're looking to open a long position on Boeing stock, you might wait for confirmation of the upside breakout. Check whether the moving average convergence/divergence (MACD) line cross above the signal line and look to see whether the volume supports any forthcoming follow-through. If all signals are "go," then look to the top of the ascending triangle pattern for potential support.
Remember: there are many ways to technically and fundamentally analyze Boeing's stock price action.
- Head over to the Member Tools section of Your Dashboard.
- Scroll down to the Summary Pages.
- Select Sector Summary > Industrial Sector Fund > Aerospace.
- Sort the columns by SCTR and company size (U). BA should be close to the top of the list.
- If you select Boeing Co. you'll see a chart of Boeing stock.
- You could also go back to Summary Pages, select Symbol Summary, and enter BA into the symbol box. This will give you a technical and fundamental summary, Boeing's SCTR, any predefined scans, alerts, and ChartLists that include Boeing stock.
Disclaimer: This blog is for educational purposes only and should not be construed as financial advice. The ideas and strategies should never be used without first assessing your personal and financial situation, or without consulting a financial professional.
Happy charting!


