Roblox (RBLX) may still be considered by some on Wall Street as a relative "noob," but the company's plans and ambitions are catching the attention of investors as its most recent Q4 22 earnings and guidance laid out a much clearer picture of its perceived arena.
Bricks Beyond the Game Space
In the past quarter of 2022, Roblox missed analyst expectations on earnings per share but beat consensus on revenue. The company reported 58.5 million daily users, a 19% increase of new "Robloxians" year-over-year.
But the most exciting thing is what it revealed about its playbook moving forward. During its quarterly analyst conference call, CEO Dave Baszucki emphasized the advantage of being able to focus on "one product, one platform." And with that singular platform, Roblox aims not only to expand its geographical and "age" reach, but beyond the gaming space toward education, concerts, and (general) communication. And with hardly any cash burn in 2022, the company sees acceleration as it heads into the first quarter of 2023.
The technicals appear to paint a similar picture.
The Technical Picture
In the last week, Roblox's StockCharts Technical Ranking (SCTR) score made a drastic jump from below 10 (Oof!) to 84.1, although it dropped a bit since then.

Chart source: StockCharts.com. For illustrative purposes only.
Let's take a look at the Roblox stock chart below. What do you see?
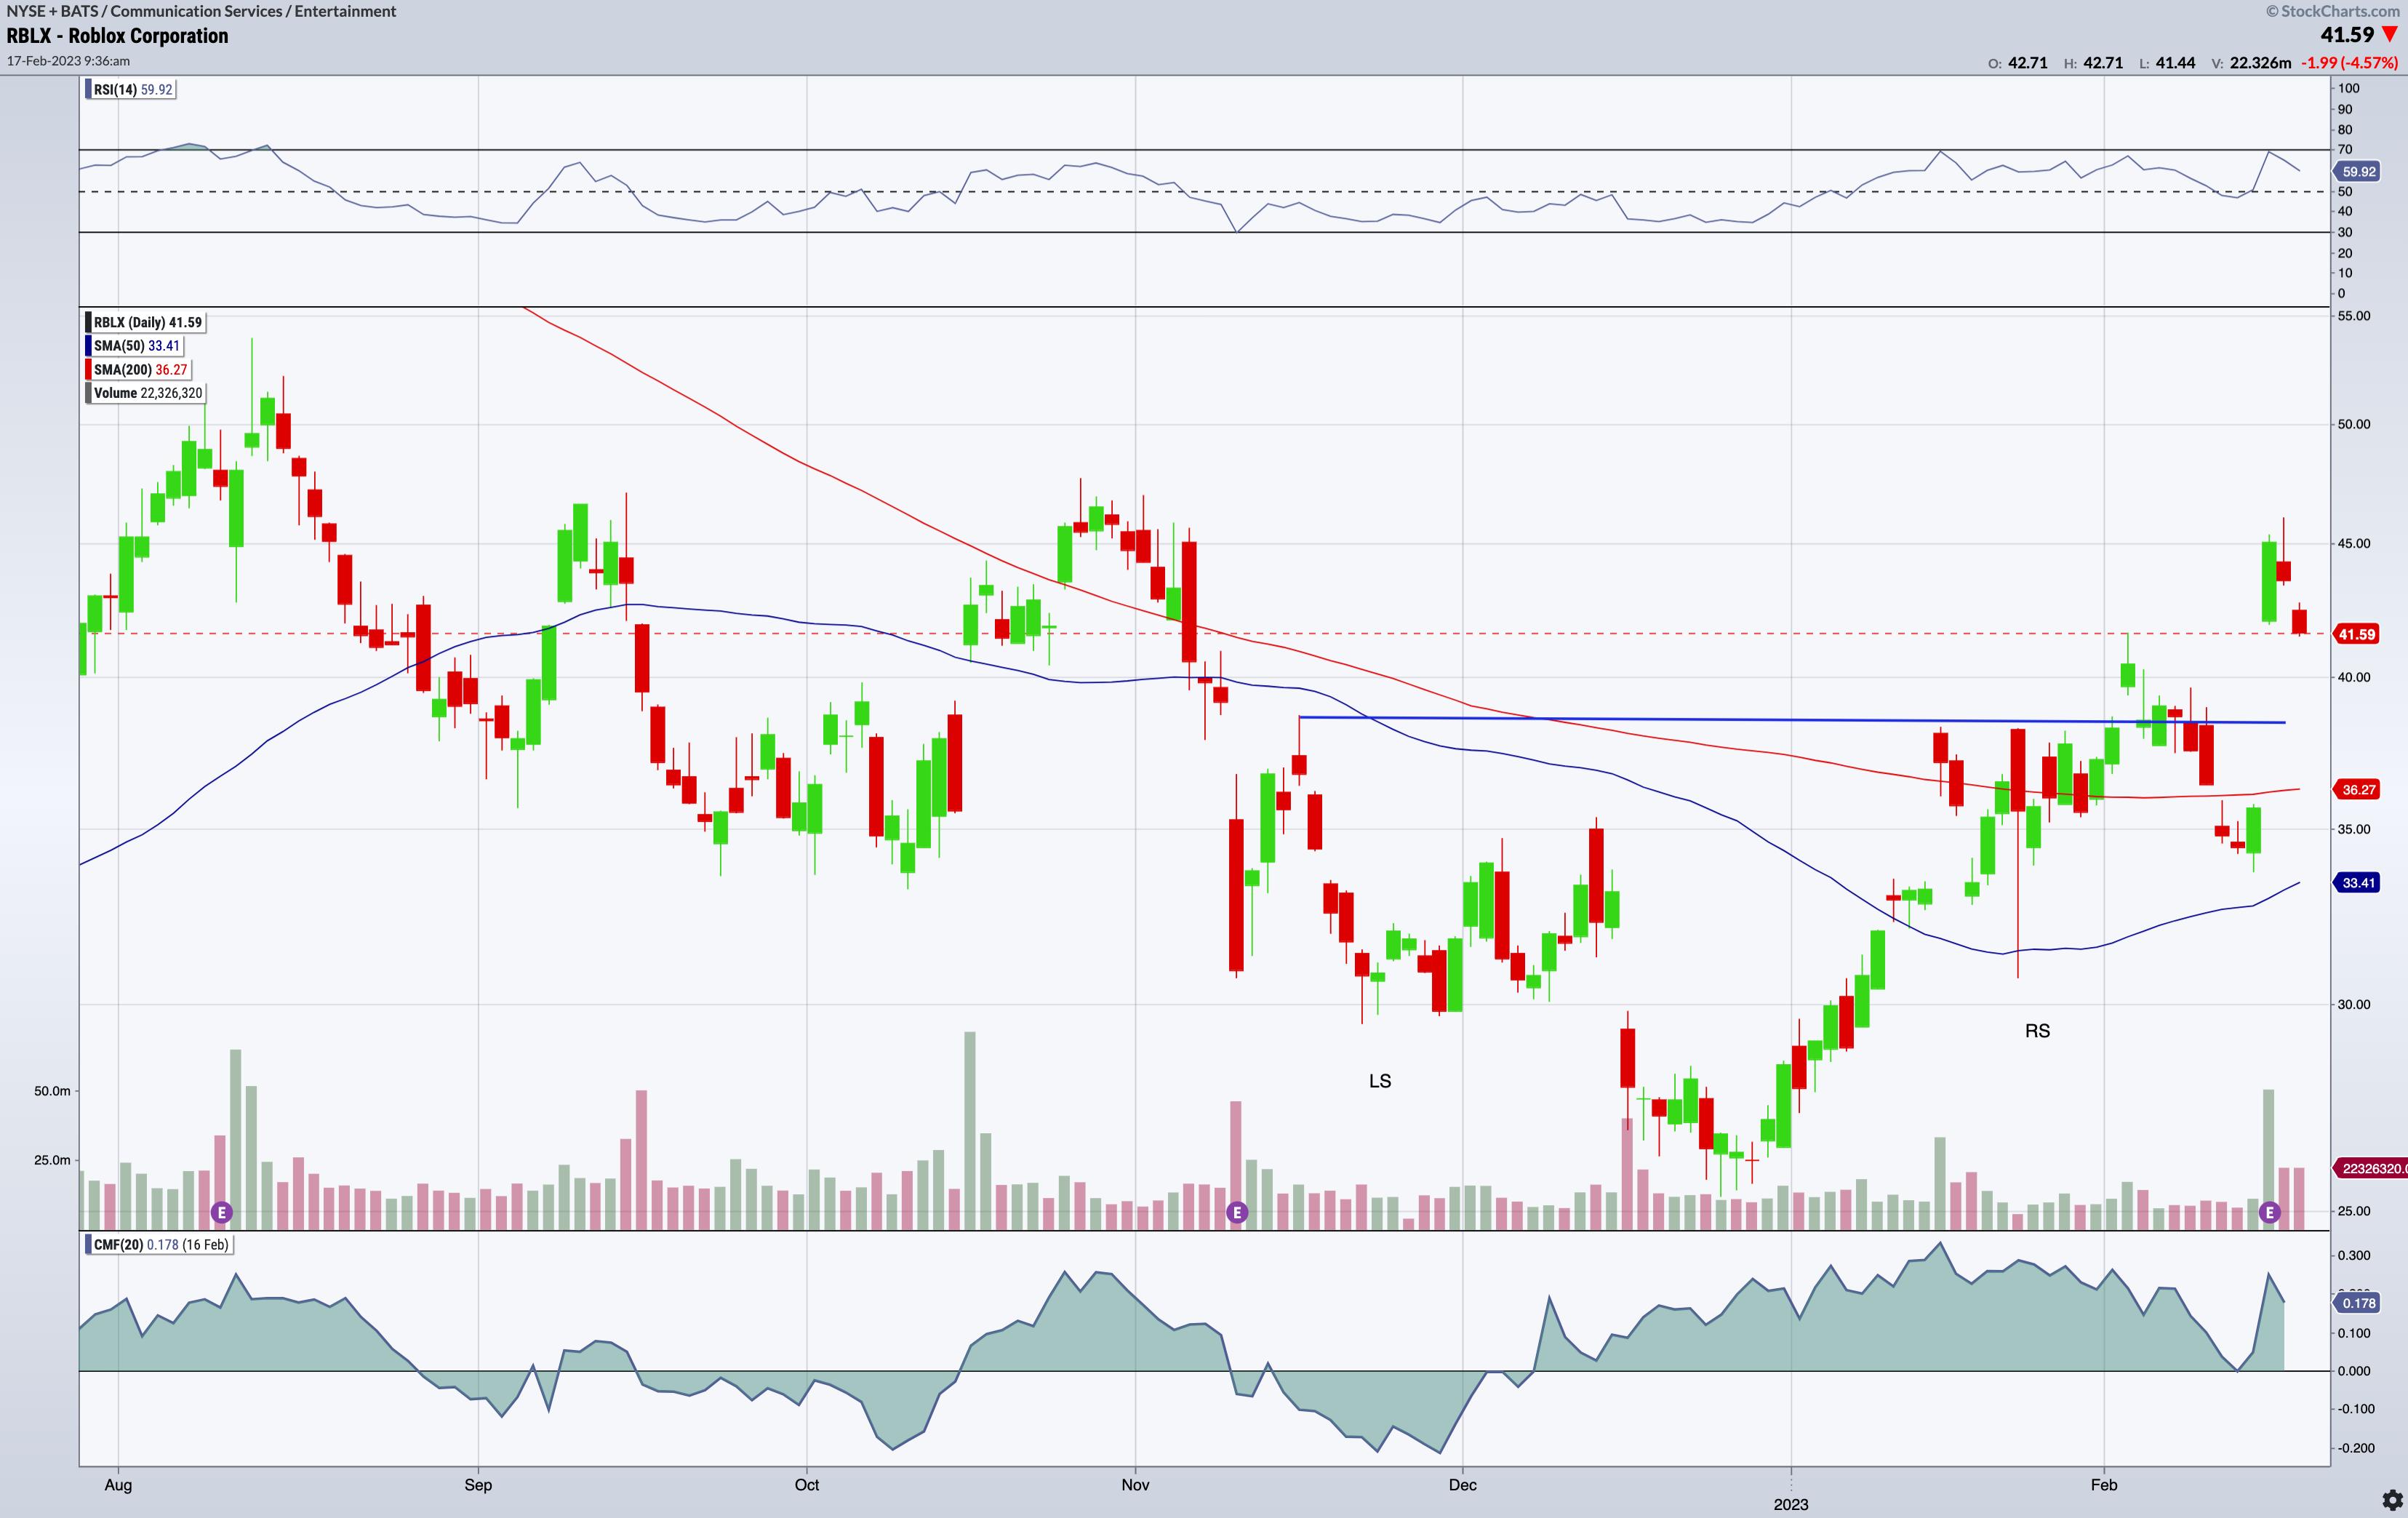
CHART 1: ROBLOX STOCK PRICE. A breakaway gap after earnings, a reverse head and shoulders pattern, and a potential Golden Cross are three things Roblox stock has going for it. Chart source: StockChartsACP. For illustrative purposes only.
A Breakaway Gap. RBLX jumped over 31% the day after earnings forming a breakaway gap above its 41.58 hurdle (resistance). If you're not familiar with this term. Breakaway gaps are pretty exciting events if only because it's fascinating to see an asset's price catapult itself beyond a level of congestion or trading range. But the congestion area, itself, is also pretty interesting, and that leads to the next point.
A Reverse Head & Shoulders. Take a look at November 21 - 30, December 23, and January 24. This should correspond respectively, to an LS, H, and an RS—in short, a reverse head and shoulders pattern. The neckline is a little messy but it also corresponds to the gap space, which often gets filled or retested.
Recovering from a Death Cross? RBLX experienced a Death Cross event on Valentine's Day 2022 (no love from Wall Street last year). The 50-day moving average (MA) is still below the 200-day MA. But with RBLX's newfound momentum, you might want to pay attention to see if a Golden Cross might be on the horizon.
Chaikin Money Flow. A great indicator for estimating buying/selling pressure, the Chaikin Money Flow indicator has been in the green (above the zero line) since early December. Though it threatened to get "pwned" (in Roblocian speak) toward negative space in the day before earnings, the indicator spiked following RBLX's jump in price. Note a slight divergence in price and money flow reading. Technically, the divergence gives us a warning signal that price is bound for a potential pullback. It's possible, especially considering the gap and the H&S neckline, but now you have to weigh this against the company's guidance, fundamentals, and market sentiment, which currently seems bullish.
Trading Roblox Stock
If you're looking to open a position in RBLX, note the technical conditions mentioned above. Plus the range between 29.45 and 30.65 seems to be appropriate stop-loss levels if you're going long (those are the "shoulder" lows). If you're basing your trading decision on the fundamental picture, be sure to bear in mind the latest producer price index (PPI) and consumer price index (CPI) reports. Both came in hotter than expected. And the PPI threatens a delayed response in transferring cost increases from manufacturers to consumers. In short, the Fed is likely to continue raising rates. More importantly, the broader market may react negatively to this news. And when the broader market falls, it tends to take most assets with it.
Disclaimer: This blog is for educational purposes only and should not be construed as financial advice. The ideas and strategies should never be used without first assessing your personal and financial situation, or without consulting a financial professional.
Happy charting!


