Target (TGT)'s stock has been bouncing back and forth within a wide eight-month trading range. This happened right after its -44% plunge between April and May last year. Since then, it's been stuck in a $45 range, forming an extremely long rectangle pattern.
Why's it a big deal? A rectangle is a consolidation zone, a temporary pause in the market. These things don't last forever, however prolonged they may be. Often, traders and investors wait for new information to take a position, either continuing the current trend or reversing it. Target's latest earnings results and guidance may shift the balance.
Will it break toward the downside? Rectangles are considered continuation patterns, and, so far, the trend has been pointing downward. Target's most recent quarterly earnings, released last Tuesday, beat analyst estimates, though guidance for the 2023 fiscal year falls below Wall Street estimates. This supports the bearish continuation thesis.
But here's the tricky thing: rectangles have been known to buck historical consistency. Given the right fundamental circumstances, Target can break toward the upside as well, so it's best to look at the stats.
What the stats say. Here are a couple of actionable tips to keep in mind.
- Generally, rectangles tend to break out toward the upside 59% of the time, whether it's a bearish or bullish continuation pattern. But...
- A partial rise before falling below support predicts a downward breakout 75% of the time.
- And a partial decline before heading toward the upside predicts an upward breakout 77% of the time.
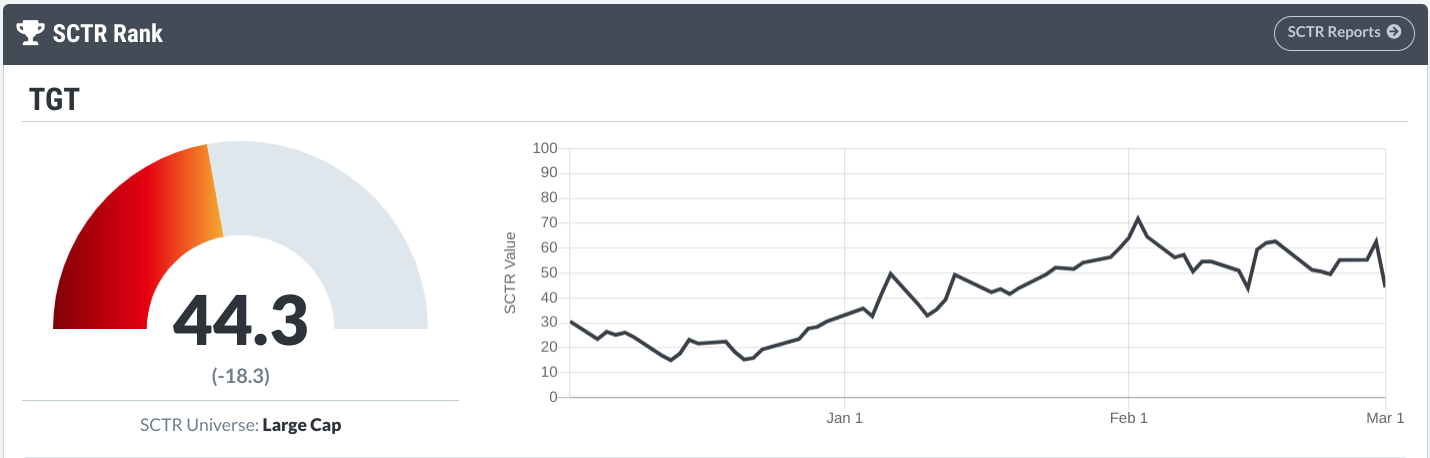
What do some key indicators say? Doesn't look too great. The StockCharts SCTR ranking gives it a bearish 44.3 score.
If you look at it comparatively in PerfCharts, you'll see that Target is underperforming its own sector (Consumer Discretionary).

And from a technical analysis perspective, indicators suggest Target's stock price could go either way. Note: Click on chart below for live version.
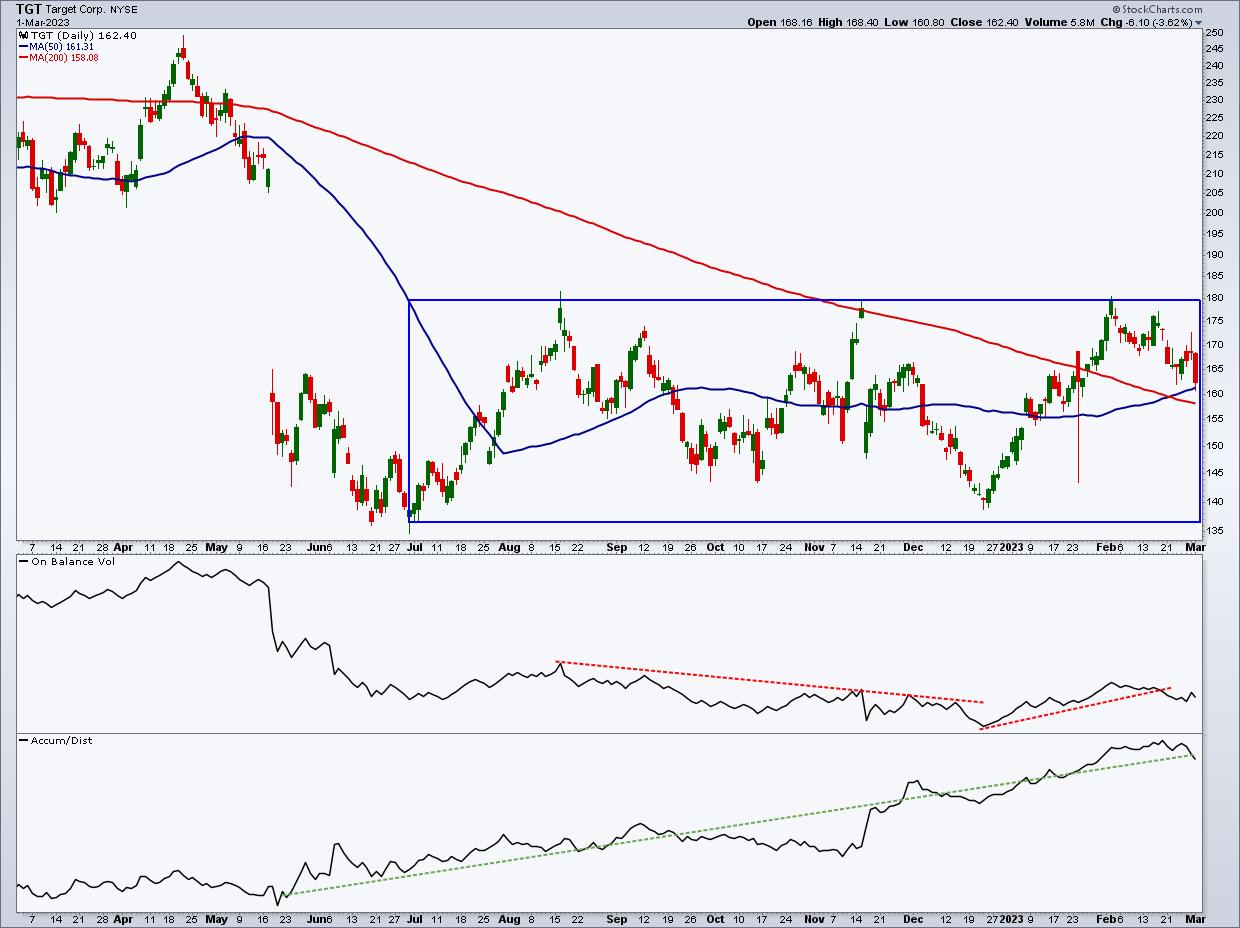
CHART 1: TARGET STOCK PRICE FORECAST. The rectangle pattern, On Balance Volume, and Accumulation Distribution Line suggest that Target could break out from the rectangle pattern to the upside or downside.Chart source: StockCharts.com. For illustrative purposes only.
Note the shift in slope of the On Balance Volume (OBV), from a downsloping line amid a ranging market to a slight upslope starting in December. Institutional buying pressure, or a fakeout?
Meanwhile, the Accumulation Distribution Line shows a steady increase in buying pressure since around June of last year. So, are we looking at a bearish continuation pattern, or is there a little institutional subterfuge going on that smacks of bullishness?
So, how do you trade it? Intra-pattern-wise, you could buy at the bottom and sell at the top of the trading range (that is, if you think the back-and-forth action will continue). But the range is pretty wide, so it's best to place trailing stops to catch the trend. Otherwise, a traditional approach would be to calculate the height of the rectangle formation and add it to the top or subtract it from the bottom to get a profit target. This would apply only after Target's stock price breaks out of the rectangle pattern.
What are the chances of reaching its target either way? If you wait for a breakout and a close beyond support and resistance, according to Tom Bulkowski of ThePatternSite.com, a rectangle pattern historically has reached its upside target 79% of the time and its downside target 55% of the time.
Whichever way you decide to play this, be sure to place your stops near or at the opposite side of the rectangle (support or resistance) as that would, of course, invalidate the trade.
Disclaimer: This blog is for educational purposes only and should not be construed as financial advice. The ideas and strategies should never be used without first assessing your own personal and financial situation, or without consulting a financial professional.
Happy charting!


