
In the next few days, SMH (VanEck Semiconductor ETF), along with other similar "chip index" funds, may see a strong bounce toward the upside.
What's going on? Technically speaking, the semiconductor index just broke out of a head and shoulders bottom on January 23, and now the index is about to test the neckline.

CHART 1: DAILY CHART OF VANECK VECTORS SEMICONDUCTOR ETF IS SHOWING STRENGTH. A breakout of a head and shoulders bottom, golden cross, and potential for stochastic oscillator and RSI to turn higher support an upward move in SMH.Chart source: StockCharts.com. For illustrative purposes only.
Where's the Head and Shoulders? It started in July. The chart above shows where the left shoulder (LS), head (H), and right shoulder (RS) are located. The volume dwindled from left to right shoulder, which is pretty typical in this pattern.
So, what does this mean? Well, it's a bullish pattern overall, despite the neckline sloping downward (upward-sloping necklines tend to fare better). Still, these patterns tend to hit their upward-bound price targets 71% of the time, according to technical analyst Thomas Bulkowski (based on 3,197 perfect trades).
Hold on, isn't the chip industry expected to hit a snag? Sort of, especially if the economy falls into recession. Nevertheless, semiconductors historically perform better than other tech sector industries because they're essential to electronic devices. Recession or no recession, people need their gadgets. And those gadgets require chips.
How's SMH performing compared to the rest of Tech? It's outperforming tech. And for a broader market reference, it's also outperforming the S&P 500 index.

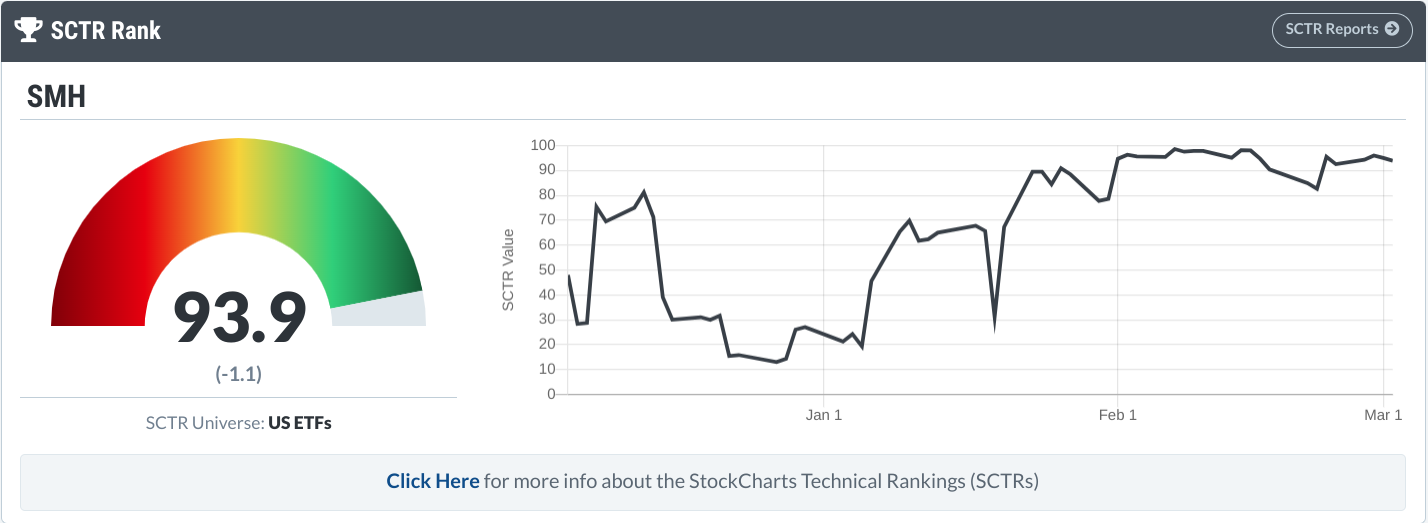
What we're looking at:
- SMH, as of this writing, has a StockCharts Technical Rank (SCTR) of 93.9, going back a three-month time frame. In contrast, the Tech Sector (via XLK) has a SCTR score of 63.5.
- First off, note the Golden Cross that occurred in January; an event that supports a potential bullish setting.
- The Stochastics Oscillator is turning upward from a relatively oversold level. The relative strength index (RSI) is also turning upward from the 50 level. So, despite the rise following the head and shoulders neckline breakout, a trader wouldn't be entering the "overbought" zone according to the stochastics oscillator or RSI.
- If SMH continues to dip, we're looking at the 225 to 235 range where the neckline is currently sloping. So, set an alert on your StockCharts platform for when SMH crosses below 225. If SMH bounces off this level, that's where traders are likely to jump in if they were to take this technical signal.
How is this pattern typically traded? A traditional approach would be to use a measured move type rule. Do you see the green vertical arrow on the chart? Typically, you'd subtract the height of the formation (neckline price - the bottom H) and add that to the breakout price. This works out to 59.42. Add that to the neckline break price of $231, and you get a price target of around $290.50. However, SMH will likely face resistance at around the $253 level, which it hit earlier this year.
As far as stop placement, it really depends on your preferences. With a potential reward of $60, how much would you be willing to risk? You could place a stop below the neckline or apply a trailing stop while in the trade.
The bottom line: This is a fleeting opportunity for an intermediate-term trade. If you're looking for anything beyond that, you might want to get a bigger picture of the broader market and economy. Again, chips tend to lead the market (mainly because the production process takes up to a year from start to finish), but the market and economy always have the final say, and that last word can sometimes hit rather suddenly and forcefully.
Disclaimer: This blog is for educational purposes only and should not be construed as financial advice. The ideas and strategies should never be used without first assessing your own personal and financial situation, or without consulting a financial professional.

Happy charting!


