
When a stock you don't own keeps going higher and higher, you probably feel regret for not buying it when it was still affordable. It's not unusual for traders to feel that way. But the reality is that no stock keeps moving up forever. Looking back at stock market history, you'll see that stocks often go in and out of favor. So, if you miss an opportunity, you don't have to be disheartened. There'll be other opportunities.
TSLA's Ride
Tesla (TSLA) is one example of such a stock. It was a Wall Street favorite from mid-2019 till early November 2021. Everyone was talking about the stock. Since then, its ride seems to have hit a few speed bumps (see the chart below). When a stock that was riding high sees its value drop, it's only natural to want to buy it. But before you do, it's a good idea to do your due diligence.
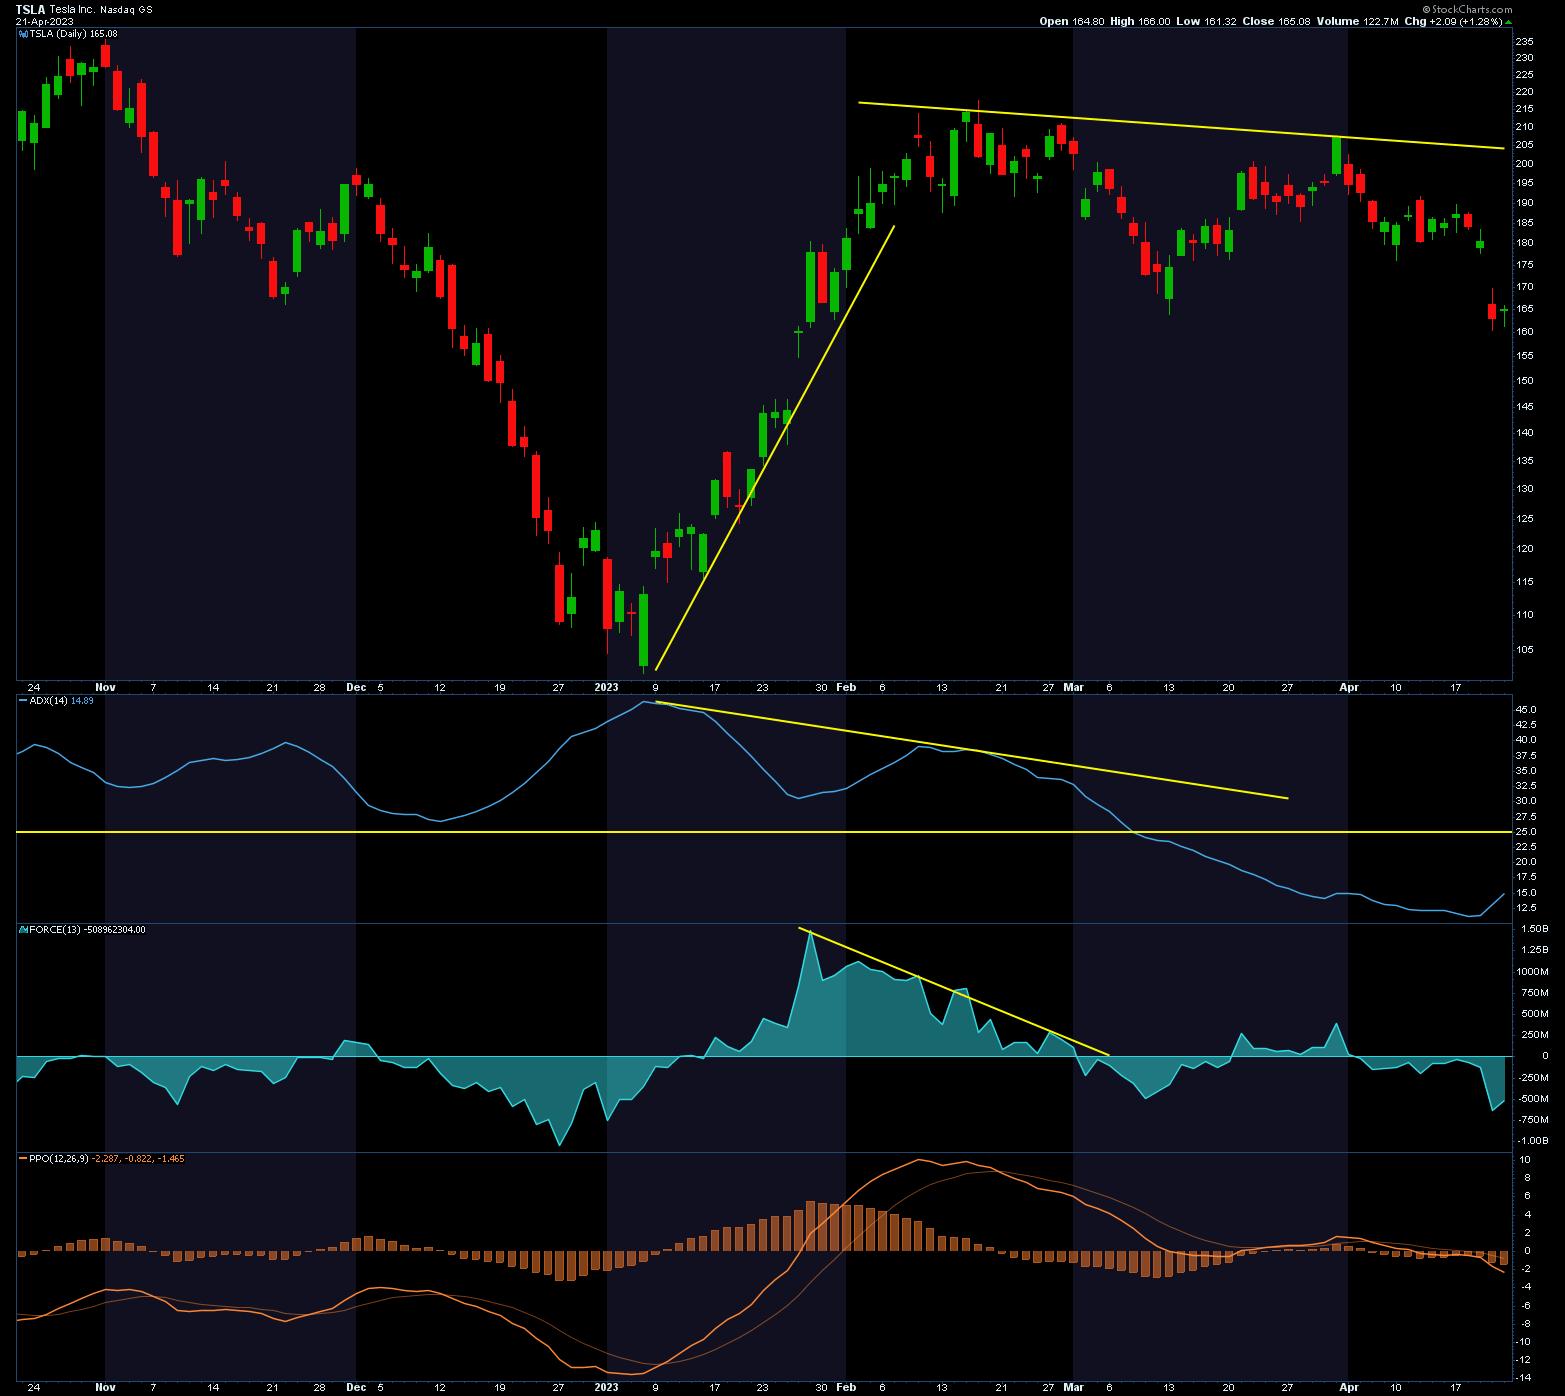
CHART 1: SIGNS OF TSLA STOCK BREAKING DOWN. Weakening trend strength, bearish force, and slowing momentum are hurdles that may be preventing TSLA stock from resuming a bullish run.Chart source: StockCharts.com. For illustrative purposes only.
Three Breakdown Signals
Here are a few reasons why TSLA stock could be slowing down.
- Trend strength. When you see a trend form, it's good to get some idea of the trend's strength. Given that TSLA stock can be volatile, the Average Directional Index (ADX) is one indicator that can help get this info. If you look at the chart of TSLA, the ADX moved higher during the downward move from the end of September 2022 and crossed above the 25 level in early October. When the downtrend ended (early January 2023), ADX peaked. When the uptrend started in January 2023, the ADX started to decline. This would have been an indication that the uptrend wasn't so strong. On March 8, 2023, ADX fell below the 25 level, which should have alerted you to the lack of strength in any upward move in TSLA. Some traders prefer to use a different threshold level for their analysis, which could give earlier or later signals. Yes, a lot of fundamental info, such as price wars, lower earnings, and potentially lower demand for new cars, dragged the stock price down. But even before that info was revealed to the public, the ADX indicated price movement in TSLA was decelerating, indicating that the stock might trend lower or stay within a trading range.
- Bullish or bearish force. When a security is in an upward trend, you want the force of the bulls behind it. If the bullish force weakens when a stock is trending higher, it indicates that the trend may not go on for too long. The Force Index can indicate whether bulls or bears have more power. In the daily chart of TSLA, there was a bearish divergence between price and the 13-period Force Index (middle sub-chart). There hasn't been much of a pickup in the Force Index since then.
- Price momentum. "The trend is your friend until it ends" is a common adage among traders. If you look at the Percentage Price Oscillator (PPO) in the lower sub-chart of the TSLA chart, the downward price move from September 2022 to January 2023 had a lot of momentum behind it. And when the trend reversed, and TSLA's stock price moved higher, PPO turned and moved higher pretty quickly, with the signal and center line crossovers. That happened until the trend reversed again, this time to the downside. Interestingly, the downside crossover in the PPO didn't stall when the stock price pulled back and tried to move higher. The lower high on February 27, 2023 was an additional signal that the TSLA stock would probably go lower.
The Final Word
Were you tempted to buy TSLA stock when it started trending higher after hitting its January low? If you didn't, you haven't missed out. The downside crossover, together with the bearish divergences in the ADX and Force Index, should have been enough to convince you that the uptrend in TSLA stock from January 2023 to February 2023 would be short-lived. Now, TSLA could still have another chance at achieving its "glamor" status. But don't be too quick to jump in. Now that you know which indicators to look at, make sure there's enough strength, bullish force, and momentum to take the stock higher before you jump in for the ride. Well, before it hits its next speed bump.

Disclaimer: This blog is for educational purposes only and should not be construed as financial advice. The ideas and strategies should never be used without first assessing your own personal and financial situation, or without consulting a financial professional.
Happy charting!


