
April is Financial Literacy Month. As a retail trader or investor, you know the value of education. There's always a new technique, tool, or strategy to learn. Sophisticated scanning tools can help identify stocks that could improve your trading process. Here's an example of using scan results to analyze a stock before trading it.
A great daily habit for traders is to run scans to identify stocks to trade. It's a methodical way to filter through the thousands of ticker symbols the stock market offers. One stock of interest, which showed up in a scan that looked for large-cap stocks that had a StockCharts Technical Ranking (SCTR) score crossing above 80, was Boston Scientific (BSX). Let's analyze the chart of BSX.
After suffering a setback during the COVID-19 pandemic, Boston Scientific (BSX) has started showing signs of growth. The stock has an exciting pattern forming, which could make it a great stock to buy if the growth signs sustain. If things don't go in the company's favor, however, you may want to move on to another stock in your scan results.
Boston Scientific is announcing its earnings on Wednesday (April 26). Investors are likely waiting for the results before they decide to buy or sell. Will the stock continue its upward move after it reports?
The Long-Term View of BSX Stock
Looking at the weekly chart over five years, BSX is trading well above its 50-, 100-, and 200-week simple moving averages. The 50-week simple moving average (SMA) is crossing above its 100-week SMA. The 200-week SMA is showing a very gentle positive slope. A steeper upward slope would be more confirming of an uptrend.
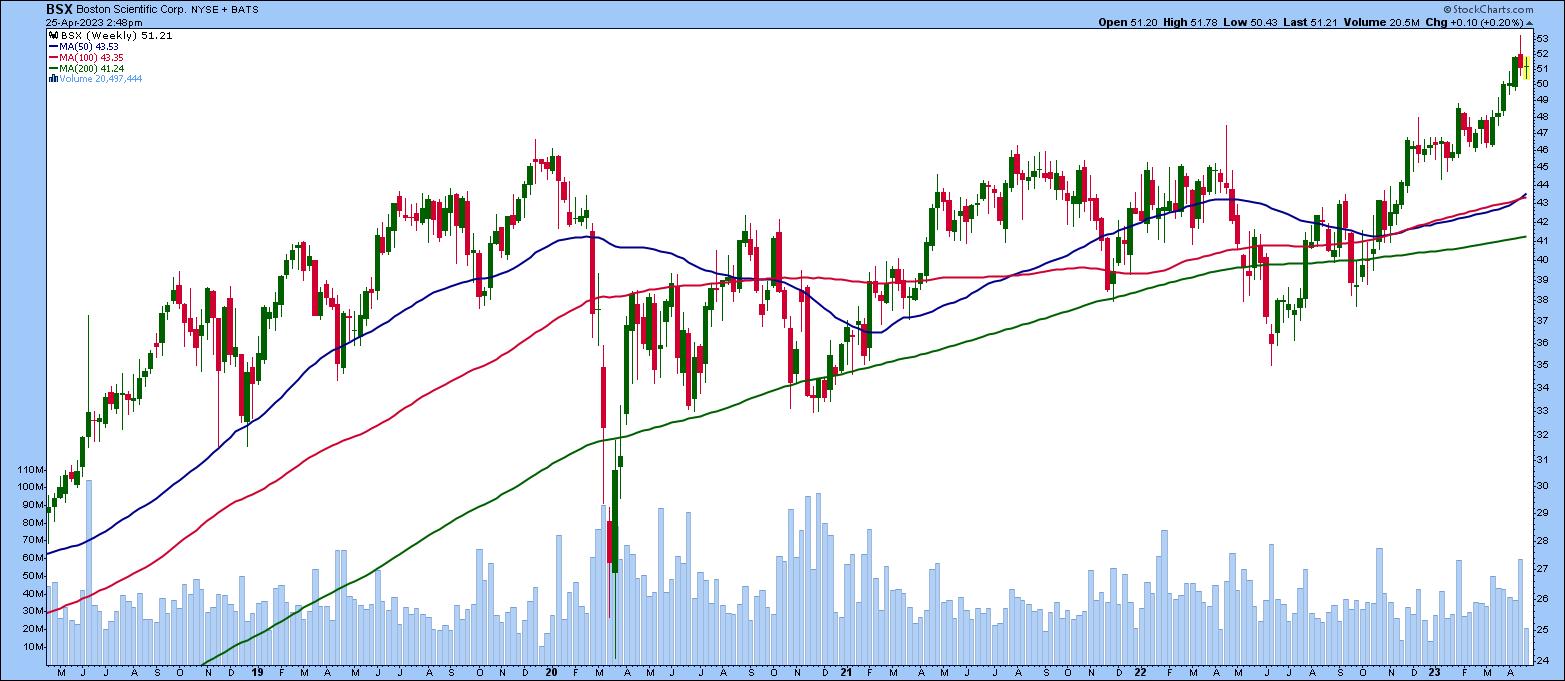
CHART 1: A LONGER-TERM VIEW. Boston Scientific stock is trading above its 50-, 100-, and 200-week simple moving averages. The stock is trending higher, but will it continue? That may depend on its earnings report.Chart source: StockCharts.com. For educational purposes only.
Zeroing In: Daily Price Action
Let's check the daily chart to see if the uptrend is in sync. The daily chart of BSX shows the 50-, 100-, and 200-day SMAs sloping upward. This agrees with what the weekly chart shows. The SCTR score displayed in the upper panel is above 80, and relative strength against the Health Care sector, using the Health Care Select Sector SPDR exchange-traded fund (XLV), is displayed in the lower panel.
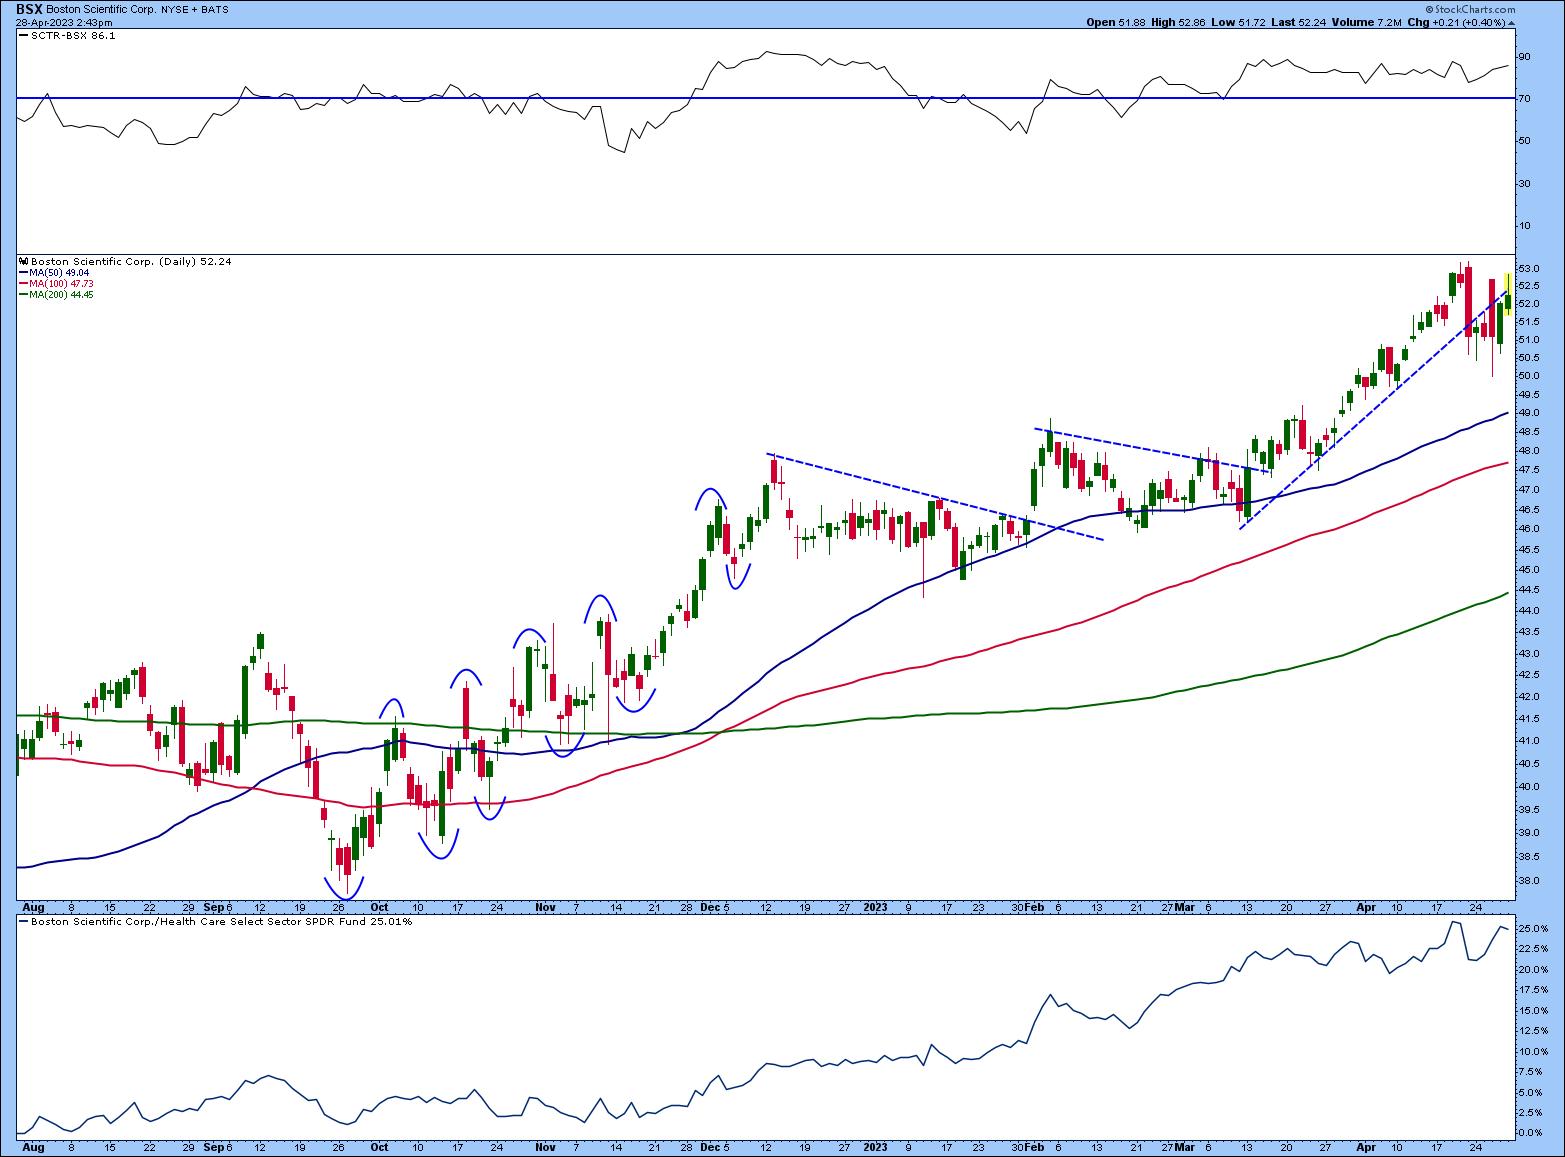
CHART 2: DAILY CHART OF BSX STOCK. The stock is trending higher, but it remains to be seen if it will break through a key resistance level. If it does, the stock could go much higher.Chart source: StockCharts.com. For illustrative purposes only.
In addition to the overall trend, the daily chart shows some interesting patterns you should watch.
- Trend direction. In late September 2022, BSX started trending higher, with a series of higher highs and higher lows. In mid-December, the upward price movement slowed, and the stock price went through a consolidation period. It started trending lower, but broke above that downward trendline on February 1, 2023 on higher than average volume. It looked like the beginning of an uptrend, but the upward price action stalled, and the stock trended lower.
- Upward move resumes. On March 14, price broke above the second downward trendline. This time, the stock price stayed above the downward-sloping trendline and continued moving higher. The stock price stayed above the third trendline up until April 21, when the stock had a massive selloff and closed below the upward-sloping trendline. The stock's price dropped on heavy volume. Since then, the trendline has been acting as a resistance level.
- Support and resistance. After falling below the upward-sloping trendline on very heavy volume, will the stock break back above the trendline and resume its uptrend? Boston Scientific's earnings results could hold the key. Let's see if the third time's the charm.
The Waiting Period Begins
As long as the SCTR score stays above the 70 level, price breaks out above the resistance of the upward-sloping trendline, and Boston Scientific's performance with respect to the Health Care sector remains strong, the stock could move higher, riding on a positive earnings report. But if Boston Scientific's earnings are not up to mark, the stock could fall to its 50-day SMA, or even lower to its 100- or 200-day SMA.
The stock is trading close to its all-time high. So, if the earnings report is favorable and the stock moves higher on strong volume, there could be a lot of upside potential. If that scenario plays out and you decide to enter a long position, place a stop loss just below that upward-sloping trendline. A move below that trendline could send the stock lower.
Other Stocks from the Scan
BSX was just one example. There are other stocks from the same scan that you could analyze. Here's a list of some of them.
- Cardinal Health, Inc. (CAH)
- Clorox Co. (CLX)
- Chipotle Mexican Grill Inc. (CMG)
- General Mills (GIS)
- Hershey Foods Corp. (HSY)
- Eli Lilly & Co. (LLY)
- Pinterest Inc. (PINS)
The Bottom Line
Scans are powerful tools that every trader or investor should use, and they can be as simple or complex as you want them to be. You can try using some of the Predefined Scans available on the StockCharts platform, or you can create one of your own. Add that to everything you've learned during Financial Literacy Month.
Disclaimer: This blog is for educational purposes only and should not be construed as financial advice. The ideas and strategies should never be used without first assessing your own personal and financial situation, or without consulting a financial professional.
Happy charting!


