
Zillow Group, Inc. (ZG) has faced a lot of headwinds in 2021. It pulled the plug on its home flipping segment, Zillow Offers, a big revenue generator. That hurt the company's bottom line, but, since then, Zillow Group has exhibited signs of turning around. It's made technological strides by offering a cool app and is experimenting in the AI space to create a user experience that eases the home search process.
ZG and Zillow Group Class C Shares (Z) were two stocks that made it to the StockCharts Technical Ranking (SCTR) scan on June 6. The stock has been trending higher, bouncing off its 100-day moving average (MA), but it's worth looking at its weekly chart to see how much upside potential the stock has.
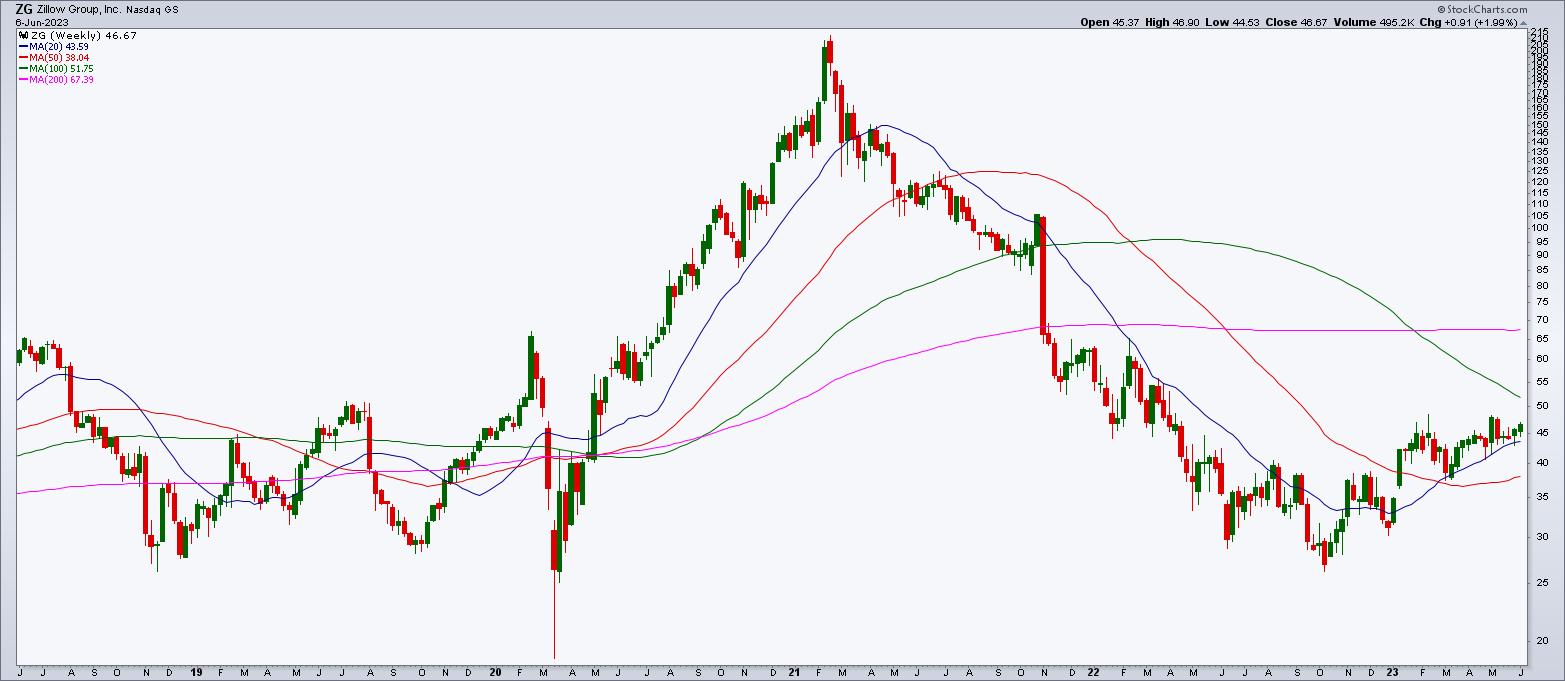
CHART 1: WEEKLY CHART OF ZILLOW STOCK. As long as the trend is up, the stock price has a lot of upside potential.Chart source: StockCharts.com (click chart for live version). For illustrative purposes only.
After peaking in February 2021, Zillow's stock price plunged, reaching a low in October 2022 that was close to its March 2020 low. Since October, the stock price has been rising and is trading above its 50-week MA. The 100-week MA is still trending lower, and the 200-week MA is relatively flat. These moving averages can act as support and resistance levels. Note that the 20-week MA is, at the moment, acting as a short-term support level.
Is the stock one to add to your portfolio? Let's look at the daily chart.
Zeroing In: Daily Price Action in Zillow Stock
The 50- and 100-day MAs are trending upward, which is a positive sign for the stock. Looking at the one-year daily chart, the stock is approaching a short-term resistance level of around $48, its most recent high (see chart below).
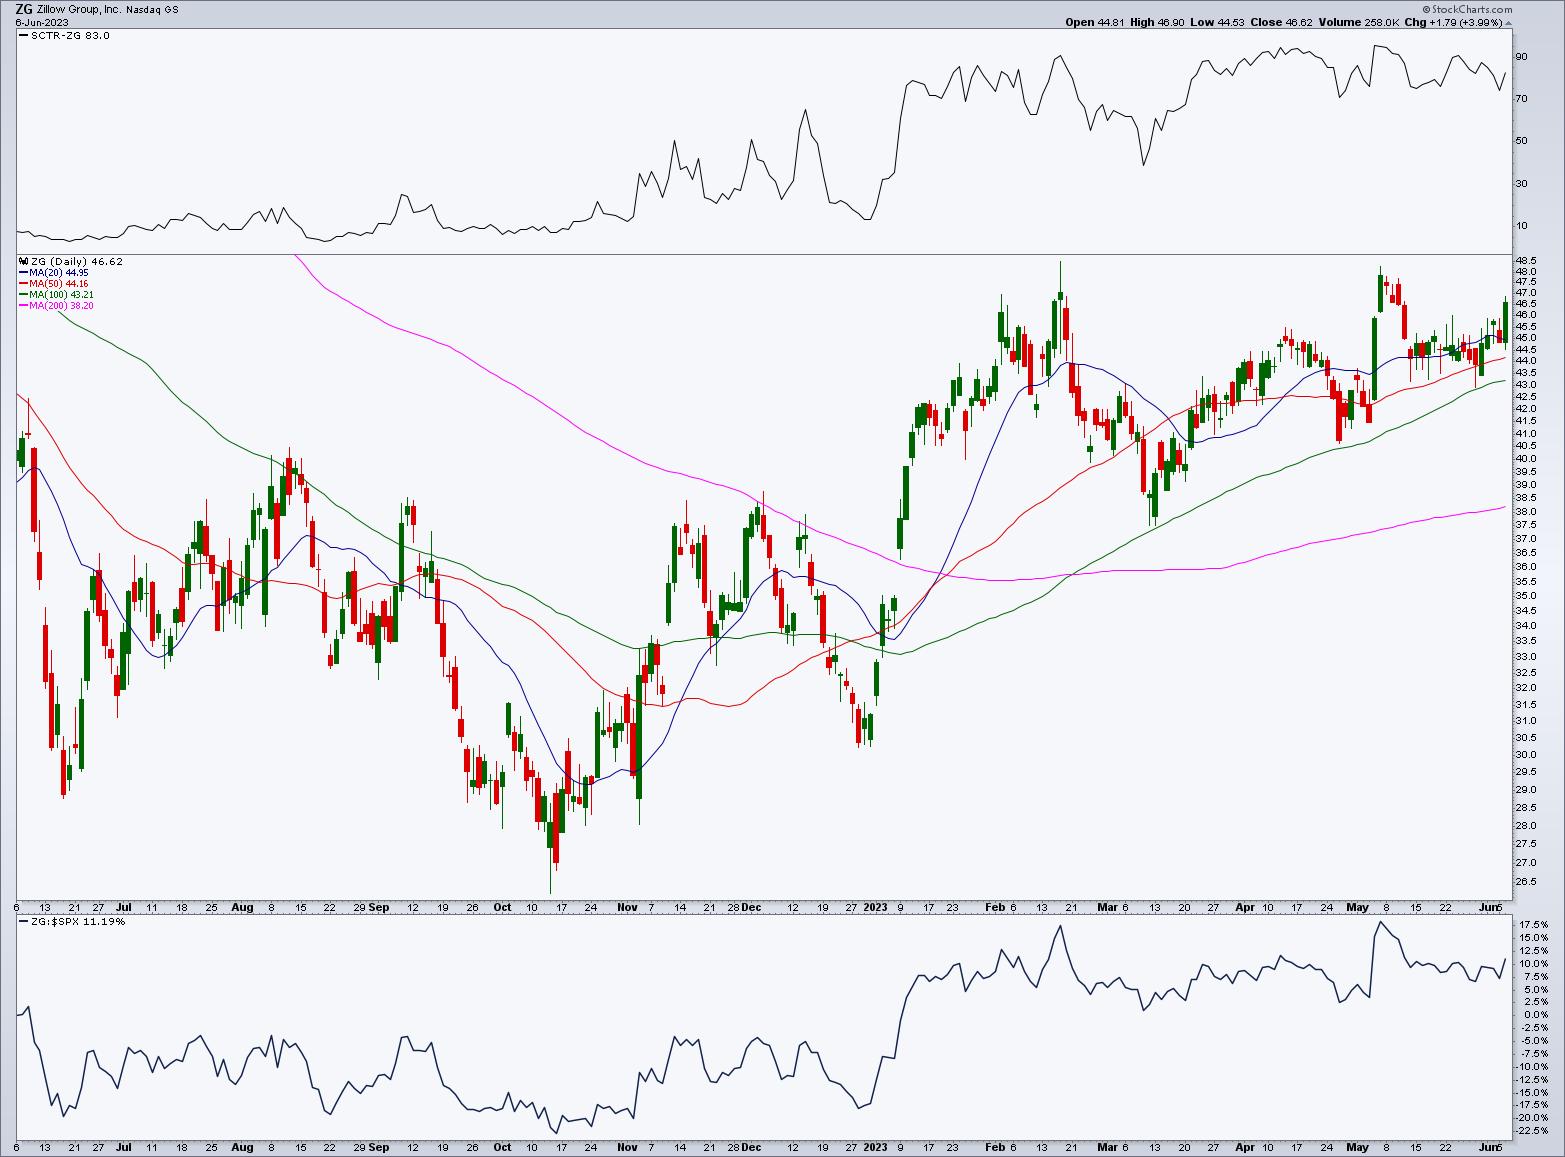
CHART 2: DAILY CHART OF ZILLOW. Upward trending moving averages, SCTR > 70, and relative strength with respect to the S&P 500 index all indicate the stock has upside potential.Chart source: StockCharts.com (click on chart for live version). For illustrative purposes only.
The SCTR score has been above 70 since March 20, and its relative strength with respect to the S&P 500 index is in positive territory. Overall, ZG is showing strength. If the stock falls below its 100-day MA and stays below it, then the uptrend would no longer be in play.
How to Trade Zillow Stock
- You may need to exercise some patience if you're considering entering a long position in ZG or Z. If the stock trades above its most recent high of $48, it would validate the uptrend.
- If price pulls back after reaching a new high above $48, then continues moving higher on above average volume, that would make a good entry point signal.
- For your price target, you'd have to look at the weekly chart to determine the first resistance level. It would probably be the 100-week MA. As long as the pattern of higher highs and higher lows continues, you want to stay in the trade. In the case of ZG, if the stock moves to the 100-week MA, stalls, and drops below the 20-week MA, you may think about exiting the trade. If the stock moves above the 100-week MA, then your next target would be at the 200-week MA.
- Keep an eye on the SCTR and relative strength on the daily chart .As long as the SCTR remains above 70 and relative strength against the S&P 500 index continues trending higher, your long position can remain in play. Use trailing stops to determine when to exit the trade. And if you have a significant position size, you can take profits on some of your positions instead of the entire investment in the stock.
Other Stocks From the Scan
Here are some of the other stocks that showed up on the large-cap SCTR scan. Do you detect any industry trends?
American Express Co. (AXP)
Baidu (BIDU)
Discover Financial Services (DFS)
Expedia, Inc. (EXPE)
Hyatt Hotels Corp. (H)
InterContinental Hotels Group PLC (IHG)
Marriott International, Inc. (MAR)
Looking Back at DOCU
On June 1, Docusign, Inc. (DOCU) was the featured SCTR scan stock. Let's look at how that stock is performing.
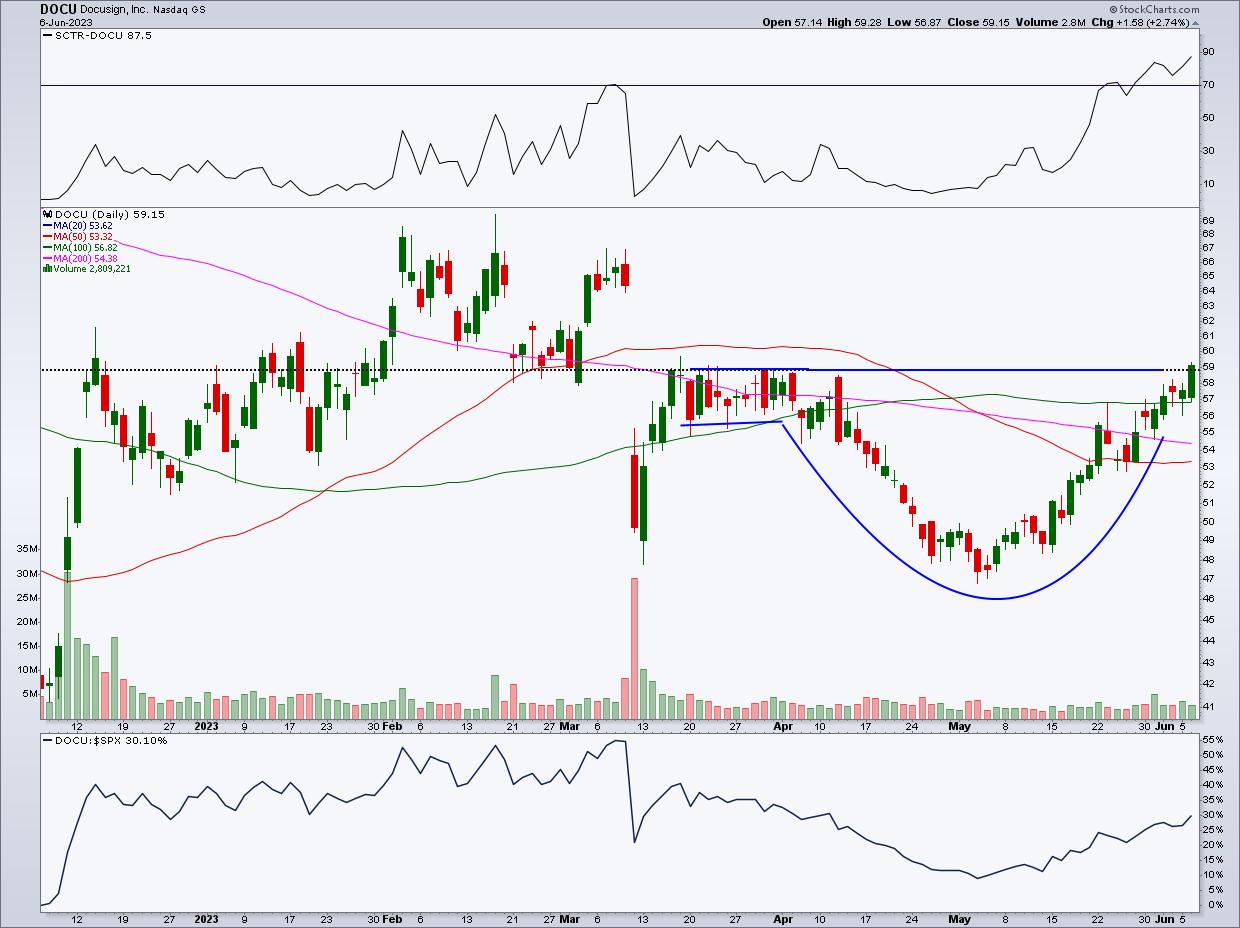
CHART 3: DAILY CHART OF DOCU. Conditions are valid from last week. If you opened a long position, be aware of market conditions so that you know when to exit your position.Chart source: StockCharts.com (click on chart for live version). For illustrative purposes only.
The SCTR is still moving higher, as is the relative strength with respect to the S&P 500 index ($SPX). The Cup with Handle (er, teapot) pattern is still in play. And the stock has broken above its $58.80 resistance level, although volume could be higher. So the conditions from last week are still valid.
SCTR Crossing Scan
[country is US] and [sma(20,volume) > 100000] and [[SCTR.large x 76] or [SCTR.large x 78] or [SCTR.large x80]]
Credit: Greg Schnell, CMT, MFTA.

Disclaimer: This blog is for educational purposes only and should not be construed as financial advice. The ideas and strategies should never be used without first assessing your own personal and financial situation, or without consulting a financial professional.
Happy charting!
