It's tempting to think of Bearish Engulfing patterns as the negative counterpart to the Bullish Engulfing pattern because, technically, they sort of are. But the Bearish Engulfing pattern also presents a trading opportunity that's unique to the downside: Stocks tend to fall three times faster than they rise.
Why is that, exactly? Investors tend to prioritize the fear of loss over the pursuit of gains (according to trading psychology). What does that mean? For traders willing to short a stock, your chances of catching a short but significant plunge may be greater than catching a sharp upward spike.
And Bearish Engulfing patterns carry exceptionally favorable stats. But more on that soon. For now, let's go over the basic characteristics of this pattern.
What are the Characteristics of a Bearish Engulfing Pattern?
A bearish engulfing pattern is a two-candlestick pattern that signals a potential reversal from a bullish trend to a bearish trend. Here are its key characteristics:
- Existing uptrend. Before the bearish engulfing pattern occurs, there should be an existing uptrend. This pattern is a reversal pattern, so it needs an upward swing to reverse.
- First candle bullish. The first candle in the bearish engulfing pattern is bullish (white or green candle), which is part of the ongoing uptrend.
- Second candle bearish. The second candle is bearish (black or red) and "engulfs" the first candle's real body. This means the opening price of the second candle is higher than the closing price of the first candle, and the closing price of the second candle is lower than that of the first candle.
- Second candle should be much larger. The bearish (second) candle must be larger than the previous bullish (first) candle. The larger the second candle, the more significant the reversal signal is.
- High trading volume to support the reversal. A higher trading volume during the session that forms the bearish candle could indicate stronger selling pressure, enhancing the reversal signal.
According to technical analyst Thomas Bulkowski's studies, the Bearish Engulfing pattern is followed by a bearish reversal 79% of the time. Its best percentage of meeting its price target occurs during a bear market, at 76%. Overall, the Bearish Engulfing pattern presents some compelling stats, and if you want to take a deeper dive, check out Bulkowski's book Encyclopedia of Candlestick Charts.
How To Scan for Bearish Engulfing Patterns
Go to Member Tools > Scroll Advanced Scan Workbench > New
Copy and paste the following code:
[type = stock]
AND [country is US]
AND [[exchange is NYSE] OR [exchange is NASDAQ]]
AND [market cap > 100]
AND [Daily Bearish Engulfing is true]
AND [Uptrend is true]
AND [Daily SMA(20,Daily Volume) > 500000]
Once the code is entered, click Run Scan.
The scan yielded several results. The most well-known stock on the list is Amazon (AMZN), so let's take a look at that.
Bearish Engulfing Candlestick Signals AMZN Pullback
Take a look at the $104 to $106 price range in the chart below.
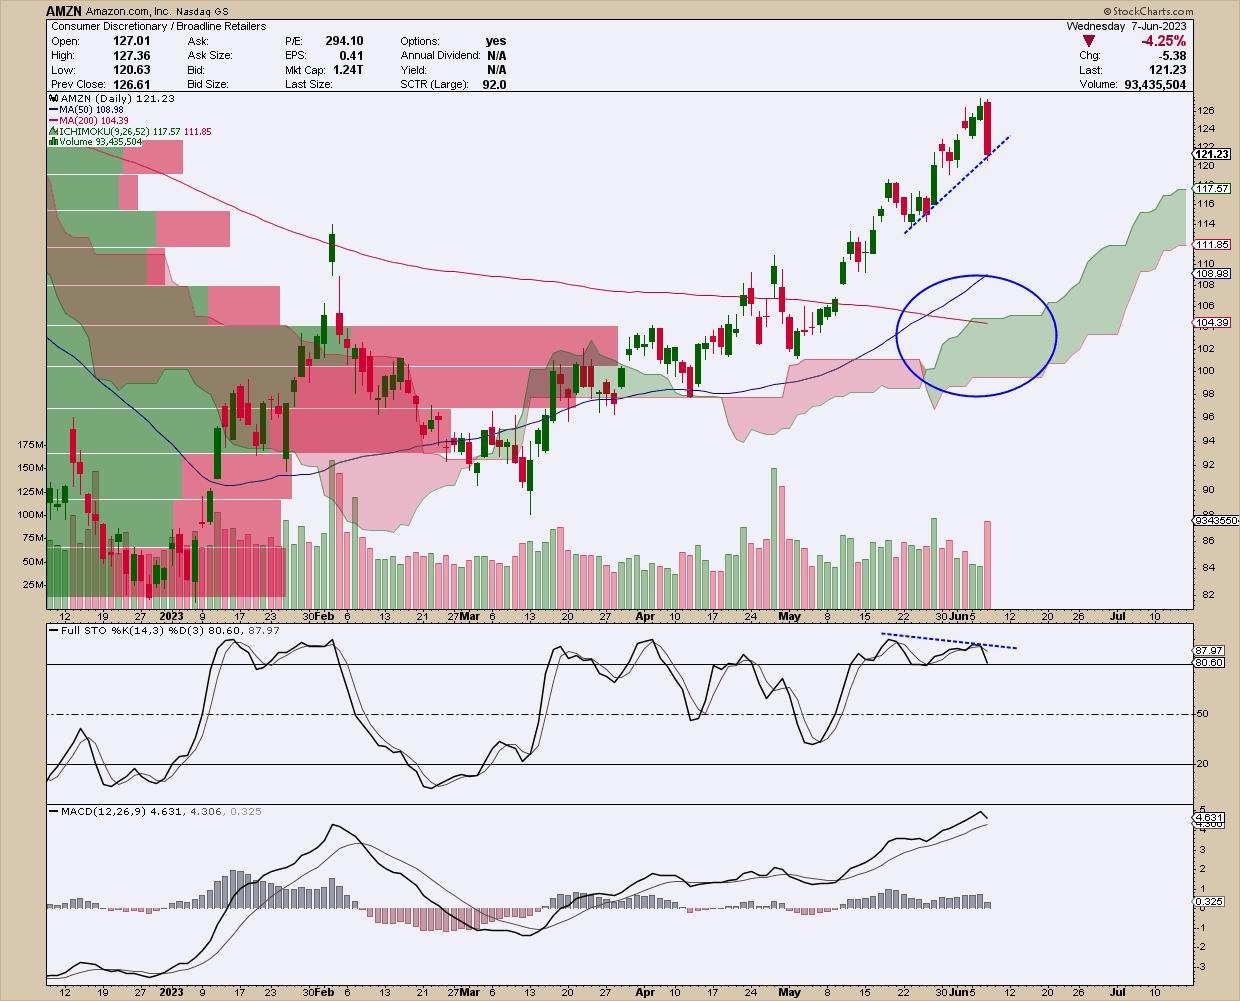
CHART 1: BEARISH ENGULFING PATTERN IN AMAZON STOCK CHART. A divergence between price highs and the stochastic oscillator indicates that AMZN may see a trend reversal. There's also a Golden Cross in the 50- and 200-day moving averages.Chart source: StockCharts.com (click on chart for live version). For educational purposes only.
Notice the Bearish Engulfing candle pattern. The divergence between the consecutive price highs and the lower highs in the overbought region of the Stochastic Oscillator is a red flag that price is likely on the verge of a reversal. The MACD hasn't confirmed this, but it tends to lag, so just keep an eye on it.
Should AMZN begin pulling back, what might it pull back to? Notice that the Golden Cross event at the end of May shows the extension of two moving averages—the 50-day SMA and 200-day SMA—that can serve as potential support levels. Underneath these averages is a thick and rising layer of Ichimoku cloud. In addition to indicating buying pressure, a bullish sign especially when thick, the green cloud also acts as potential support. Converging with this range of support (between $104 to $106) are the largest Volume by Price bars, indicating both heavy trading activity and potential support.
If you look at a 12-month chart (see chart below), you can see that the support range also coincides with the 50% to 61.8% Fibonacci Retracement levels starting from the second leg of AMZN's uptrend, and that $105 has a long history as both support and resistance (fuchsia circles).
The Ichimoku cloud and 200-day SMA are on the chart for reference (to compare with chart 1).
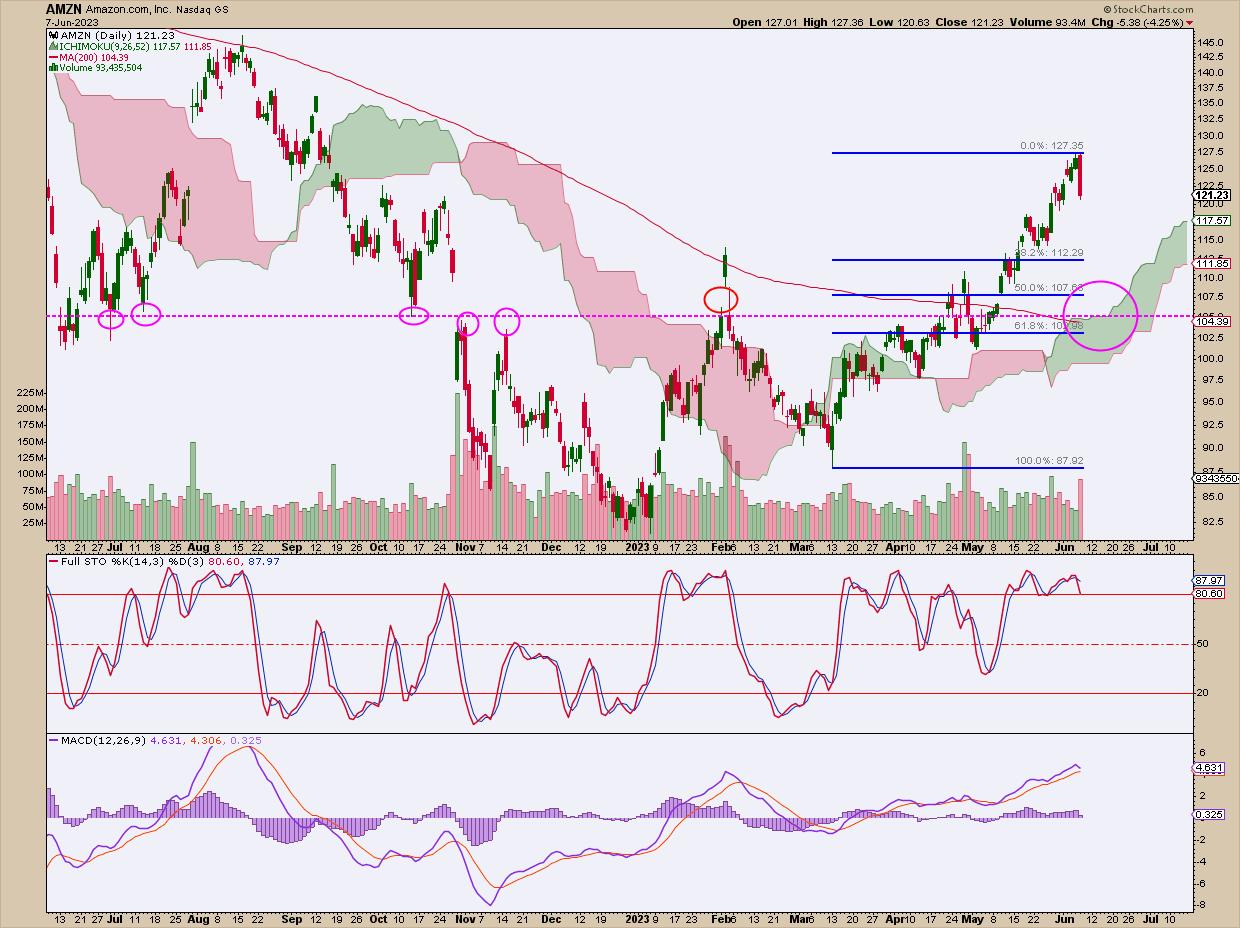
CHART 2: ONE-YEAR CHART OF AMZN. Here, you see the horizontal line that represents historical support and resistance levels. The Fibonacci retracement levels, starting at the second leg of the most recent uptrend, show that the 61.8% retracement is close to $105.Chart source: StockCharts.com (click on chart for live version). For educational purposes only.
How Do You Trade a Bearish Engulfing Candle?
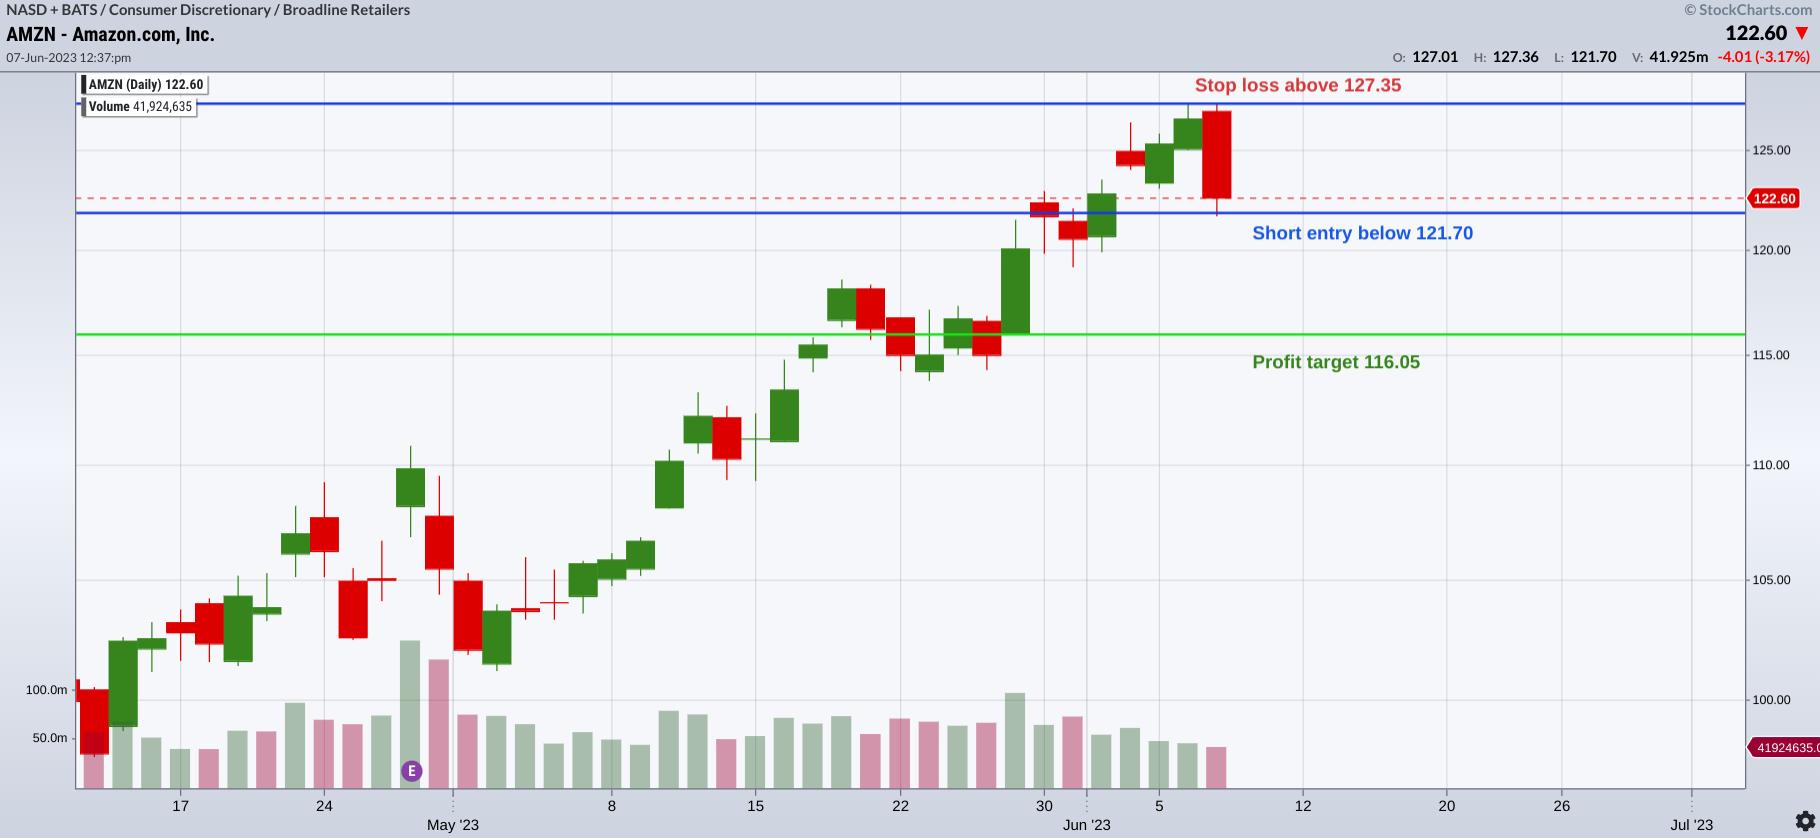
CHART 3: TRADING AMZN. Here you see the entry, profit target, and stop loss for a short position.Chart source: StockChartsACP. For educational purposes only.
- On the following trading day (assuming the engulfing pattern remains intact), you would place a short entry right below the low of the engulfing candle;
- You'd place a stop loss at the top of the formation (either the engulfing candle of the candle before it, whichever is taller);
- Your profit target would either be a 100% measure of the entire formation (a one-to-one risk/reward approach); or
- You would exit at the closest support level.
Say AMZN closed at $122.60 (see chart below). The high is $127.36 and the low is $121.70. The total risk would amount to $5.65. For the shorter-term trade, you would take the dollar-value measure of this pattern's height and subtract it from the bottom, giving a price target of $116.05 to cover your short position.
The second, further target would be the near-term support at $115 and the $104-to-$106 range, as pointed out in the charts above.
Other Stocks in the Scan
Here are some other notable stocks and exchange-traded funds (ETFs) that showed up on the scan.
ProShares UltraPro QQQ (TQQQ)
Invesco QQQ Trust (QQQ)
Adobe Systems, Inc. (ADBE)
Shopify, Inc. (SHOP)
MetaPlatforms, Inc. (META)
Looking Back at Walmart's Bullish Engulfing Pattern
Last week's article discussed the bullish side of this same candlestick pattern. The stock in focus was Walmart (WMT). Similar to the trade setup above, the "measured" profit target had the best chance of succeeding. Let's take a look at how it did.
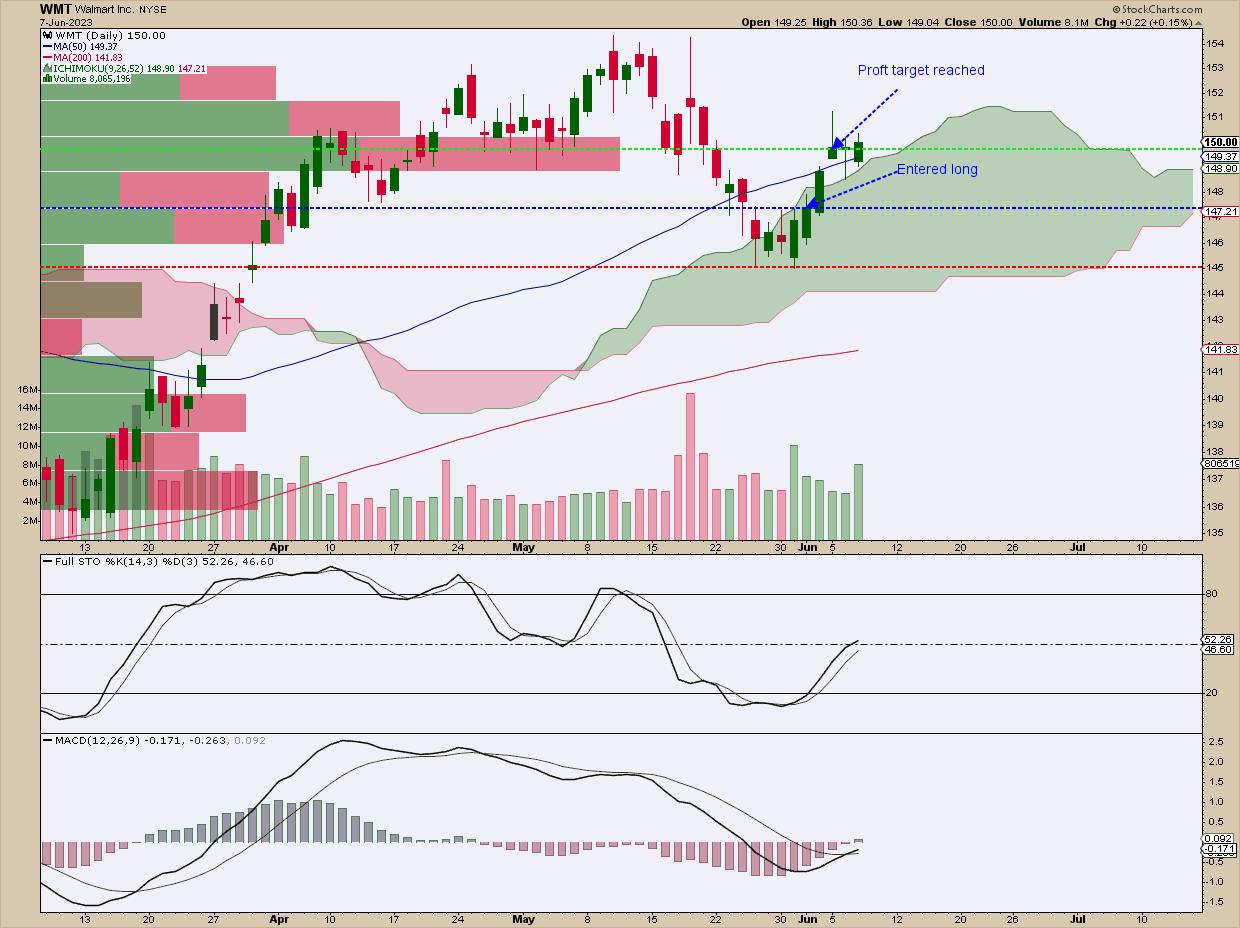
CHART 4: A WMT TRADE. The profit trade was reached three trading days ago.
Set a profit target based on the formation height (147.31 - 145.01 = 2.30). Add the 2.30 to the top of the formation. This gives you $149.61, which was reached three sessions later.
The Bottom Line
Because markets tend to fall faster than they rise, trading the short side of the market can sometimes present sudden and dramatic opportunities. Bearish Engulfing patterns may not be surefire signals of a decline, but they come pretty close, as their stats—a 79% bearish reversal rate—seem pretty compelling. Good luck and happy trading!

Disclaimer: This blog is for educational purposes only and should not be construed as financial advice. The ideas and strategies should never be used without first assessing your own personal and financial situation, or without consulting a financial professional.
Happy charting!
