TAKEAWAYS
- AMD is in a technical (near-term) downtrend, but its fundamentals promise otherwise
- AMD's stock price is trailing NVDA, though its lead over the rest of the industry appears to be waning
- AMD is in a technical "buy" range and the potential for a bullish rally rests on its new AI chip announcement and its April 30 earnings report

Leading chip designer Advanced Micro Devices, Inc. (AMD) is at a critical juncture, one which could go either way depending on the dynamics of the market and its specific industry. The stock's technical and fundamental indications are not only mixed, but on opposite extremes.
Now that AMD's price has fallen to a key level, bullish investors may wonder if it's wise to buy the dip or avoid a falling knife.
AMD's Technical vs. Fundamental Outlook
AMD's technical strength is rapidly declining: with a StockCharts Technical Rank (SCTR) score of 89.9, the chipmaker is showing up on bearish scan results, including the P&F Double Bottom Breakdown, P&F Descending Triple Bottom Breakdown, and Stocks in a New Downtrend (ADX), all of which can be found on the StockCharts Sample Scan Library.
Fundamentally, a ray of light shone on Tuesday when AMD unveiled its latest new processors designed to power AI-enabled PCs—Ryzen Pro 8040 (laptop) and the Ryzen Pro 8000 (desktop)—which the company claims are the most powerful chips for business computing. If they perform as AMD expects, these chips can potentially catapult AMD's position against rivals Nvidia (NVDA) and Intel (INTC) in the generative AI arena.
What are analysts saying about upside price targets? There's a vast range: from $180 to $270. To be fair, bearish analyst targets are also well below current prices, around $110 to $120. So, even if you're bullish, consider the downside projections (and why some analysts might be bearish).
The Macro View
While AI technology had simmered in the tech undercurrents for years, the AI arms race ignited on November 30, 2022, with OpenAI's release of ChatGPT. Powered by Nvidia's powerhouse GPUs, this watershed moment marked a seismic shift in the semiconductor industry.
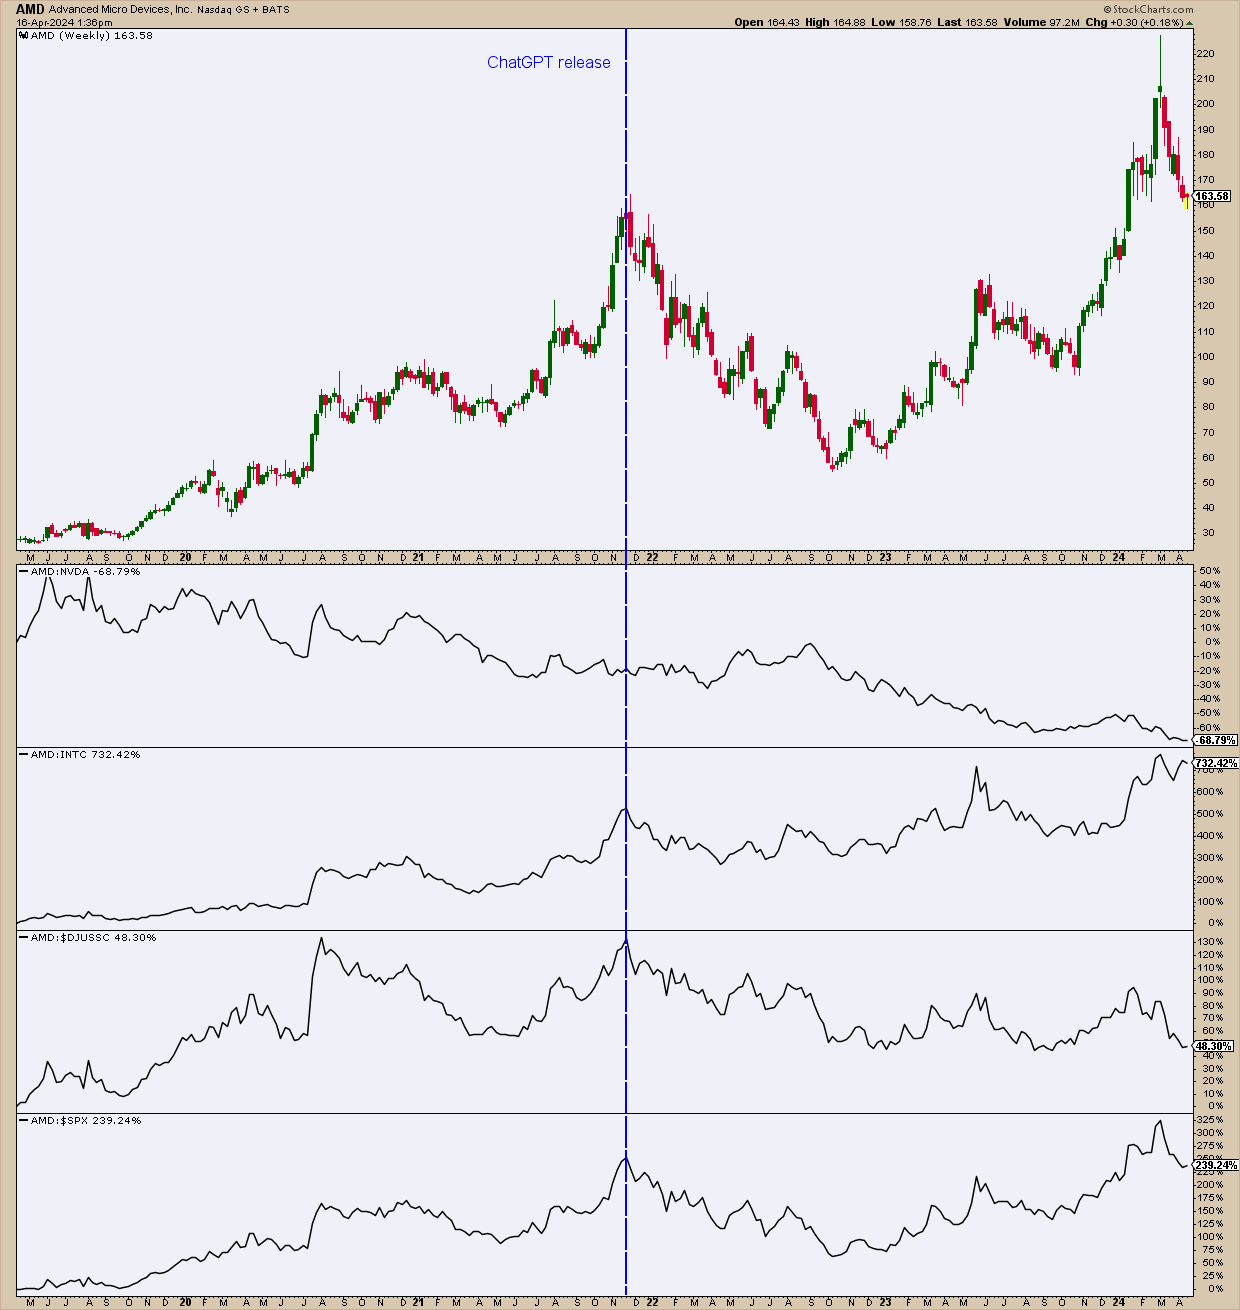
CHART 1. WEEKLY CHART OF AMD: The blue vertical line marks the week ChatGPT was released to the public, creating a fierce competitive environment among chipmakers.Chart source: StockCharts.com. For educational purposes.
While many semiconductor stocks fell at the end of November 2022 due to geopolitical hurdles (US export restrictions to China) and general expectations of an economic slowdown, this also marked the moment when AMD began significantly underperforming NVDA (soon to become the top AI chip producer).
Against NVDA, AMD is underperforming by over -68%. However, AMD managed to overtake Intel (INTC) by a stunning 731%. Relative to the Dow Jones U.S. Semiconductors Index ($DJUSSC), AMD's performance is declining, though still leading the average by 48%. And against the S&P 500 ($SPX), AMD's performance is up 238%.
Looking at the technicals from a macro view, is AMD in a downtrend or a near-term dip?
Is it Time to Buy the Dip?
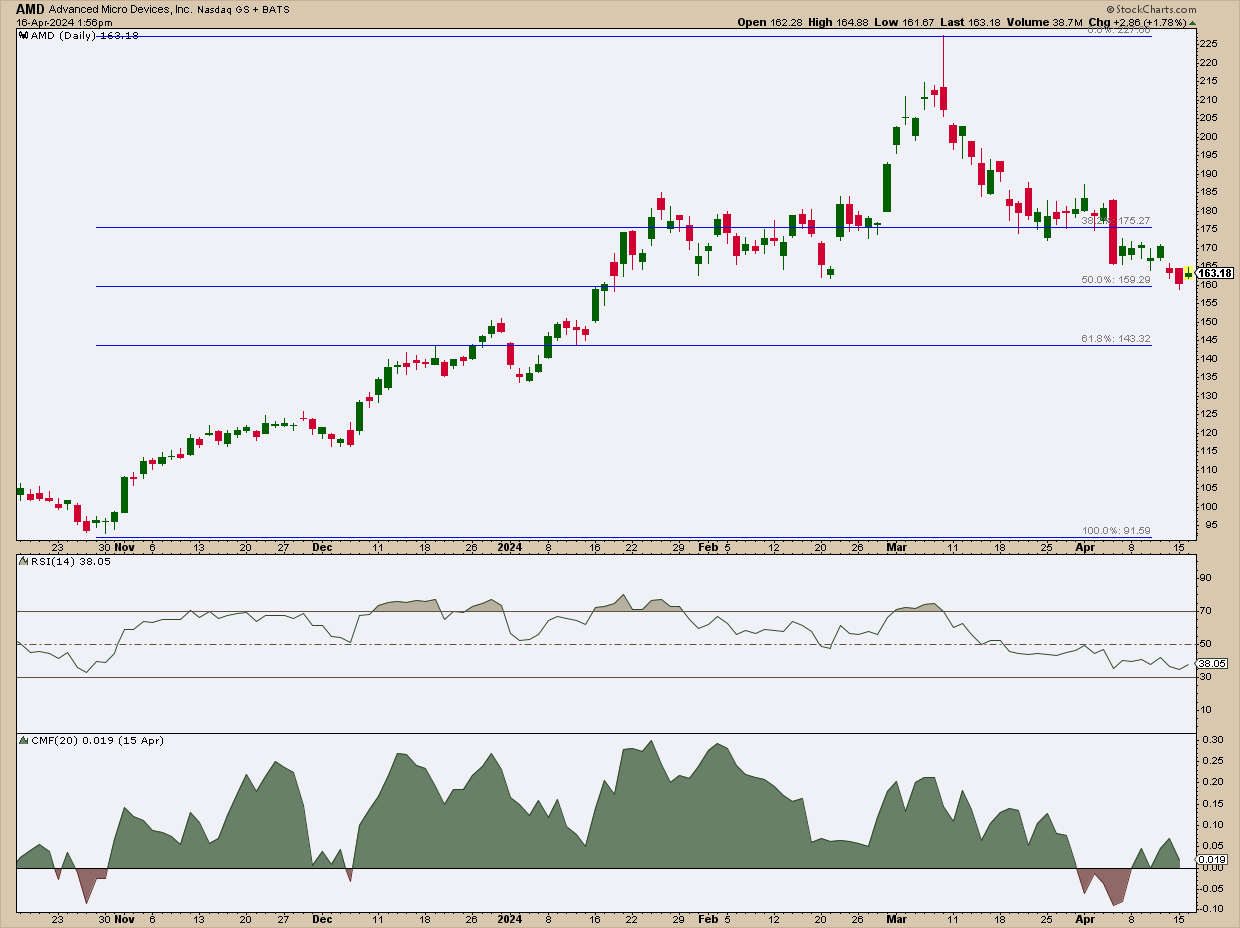
CHART 2. DAILY CHART OF AMD. AMD may be in a relatively deep decline, but the momentum, support levels, and fundamental story tell a different story. Chart source: StockCharts.com. For educational purposes.
The fundamental story fueling a potential bounce is more important than the technical indications of a bullish reversal. AMD broke below support levels of $170 and (below that) $165, both bearish indications for the chipmaker.
As the Relative Strength Index (RSI) steadily approaches the 30 line (which marks the oversold threshold), note the rising buying pressure, as indicated by the Chaikin Money Flow (CMF) climbing above the zero line—a signal that buyers are now entering the market.
AMD is resting right above a critical Fibonacci retracement level (50%), which explains why more technically inclined buyers might have begun accumulating shares of the stock (the 61.8% to the 50% levels are often buy targets for bullish traders looking to go long).
What This Means for Your Portfolio
So, does this mean you should buy the dip? It depends on how bullish you are on AMD and why you might have a bullish bias. Perhaps waiting for a stronger bounce with more significant momentum may be the thing to watch if you are. AMD is in a buying range, but how you approach accumulating the stock depends on you and your strategy.
Also, note that AMD's earnings report is on April 30. Monitor the action leading to and/or following the report.
The Bottom Line

AMD is at a crucial juncture, balanced between tepidly bearish technical signals and promising fundamentals from its latest AI-capable processors. The broader semiconductor sector's struggles—sparked by geopolitical tensions and economic fears since ChatGPT's launch—frame AMD's precarious market stance. Whether to buy the dip hinges on whether you believe AMD can redefine its competitive edge, jump ahead of its rivals, and challenge NVDA. AMD is within buy range, but you may want to nuance your entry if you're itching to go long. Be sure to add AMD to your StockCharts ChartList.
Disclaimer: This blog is for educational purposes only and should not be construed as financial advice. The ideas and strategies should never be used without first assessing your own personal and financial situation, or without consulting a financial professional.
Happy charting!


