TAKEAWAYS
- NFLX is close to a strong resistance level and could break above it if the company beats earnings estimates
- Netflix's stock price has been trending higher since July 22 after the stock took a deep plunge
- Expect a lot of volatility after NFLX announces earnings on Thursday following the close
It's showtime! On Thursday, after the stock market closes, Netflix, Inc. (NFLX) will announce Q1 earnings. The stock is close to a major resistance level. Will it break through when it reports earnings? Or will it fall? The answer depends on whether it beats or misses.
Wall Street analysts expect stellar results—NFLX is expected to report adjusted EPS of $4.52 per share, well above the $2.88 in the prior-year quarter. Revenue is projected at $9.27 billion, up 13.6% from a year ago.
A Longer-Term View of NFLX Stock
Looking at the weekly chart of NFLX (see below), the stock price is approaching its all-time high. NFLX stock is trading above its 13-week simple moving average (SMA), and its relative performance suggests NFLX is underperforming the S&P 500 ($SPX) on a weekly scale.
Note: The 13-week SMA represents one quarter.
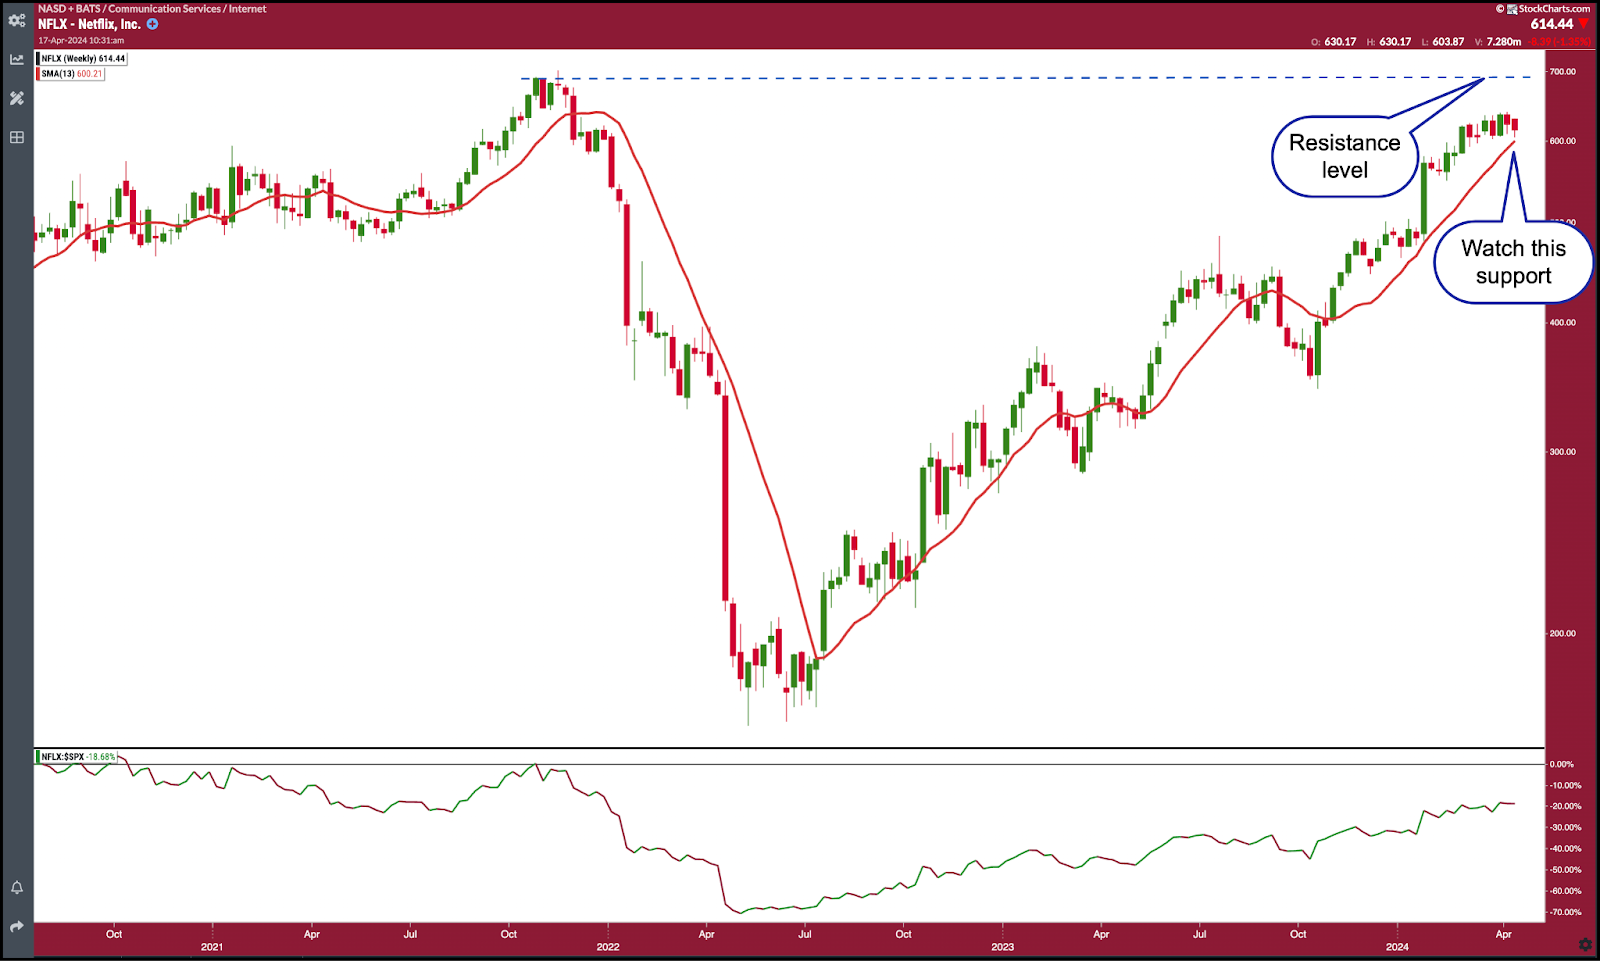
FIGURE 1. WEEKLY CHART OF NFLX STOCK. NFLX has been trending higher since July 2022. Whether the stock continues in this direction depends on its earnings report. The stock is close to its 13-week SMA and is approaching a strong resistance level.Chart source: StockChartsACP. For educational purposes.
If NFLX beats analyst estimates and delivers strong guidance, its stock price could reach its all-time high and have enough follow-through to rally higher. NFLX has a lot up its sleeve.

Despite increasing competition from Apple (AAPL), Amazon (AMZN), Walt Disney (DIS), and Comcast (CMCSA), NFLX has maintained its leadership position in the streaming space. NFLX continues releasing more content and plans to expand its sports offerings, including the live event of Mike Tyson vs. Jake Paul this summer. There are lots of other sports content in the works, all of which are expected to appeal to a broader audience.
If all goes as expected, NFLX could soar well past $700, but earnings reports can move the stock price either way. With the earnings release coinciding with an overall equity market correction, if earnings disappoint or if guidance is weak, NFLX could see a massive selloff. Some areas that could be soft are advertising revenue and the number of new memberships.
If the stock price falls below its 13-week SMA, it could be a repeat of what occurred at the end of 2021 after the stock price hit its all-time high. Note how steep the descent was.
A Shorter-Term View
Turning to the daily chart, NFLX stock is trading just above its 50-day SMA, but the relative strength index (RSI), an indicator that gauges momentum, presents an intriguing picture. While NFLX's stock price was trending higher (late Jan to April 2024), the RSI (lower panel) was trending lower. This raises a red flag, since it indicates that momentum is slowing—a bearish divergence.
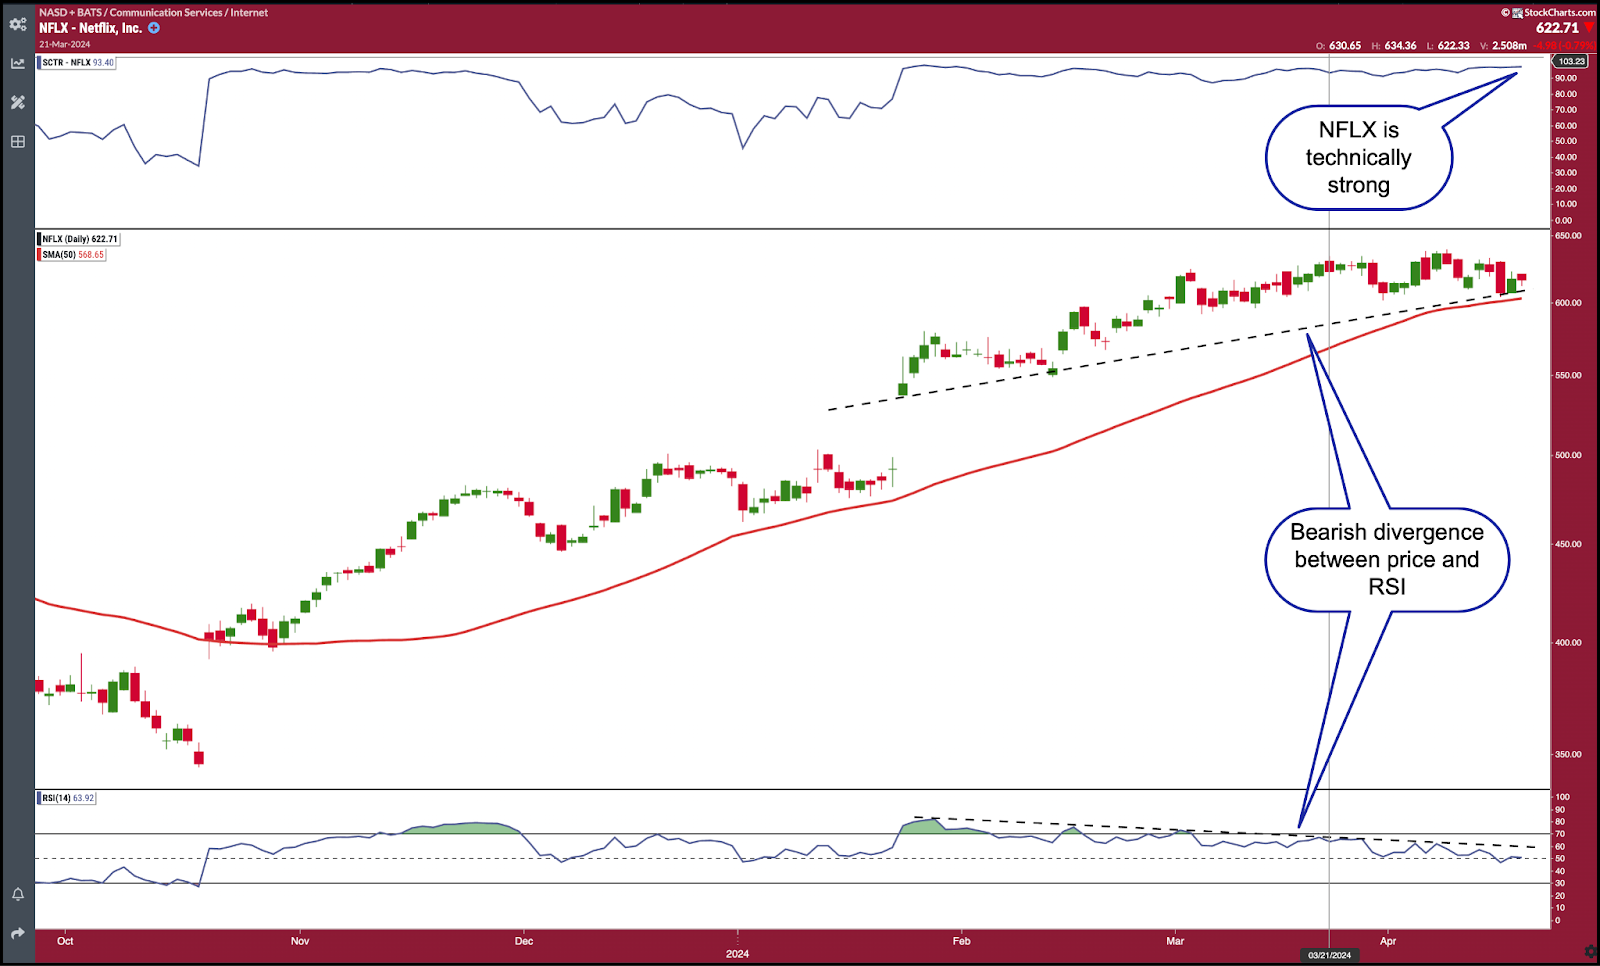
FIGURE 2. DAILY CHART OF NFLX STOCK. The divergence between price and RSI is concerning, but that could be because investors await the earnings results before deciding to buy or sell NFLX stock.Chart source: StockChartsACP. For educational purposes.This begs a sanity check to see if NFLX is technically strong. Adding the StockCharts Technical Rank (SCTR) to the chart is helpful. The SCTR score is at around 97, which indicates that NFLX is still a strong stock (upper panel).
Final Thoughts
Looking at the options quotes for NFLX in StockCharts, the implied volatility (IV) of options expiring on Friday, April 19, is around 150%. This means you can expect a lot of volatility in NFLX's stock price around the earnings date. This may explain why the RSI has declined—investors are awaiting the earnings report.
There's also increased activity in the out-of-the-money call options, which indicates that the directional bias is to the upside as of this writing.
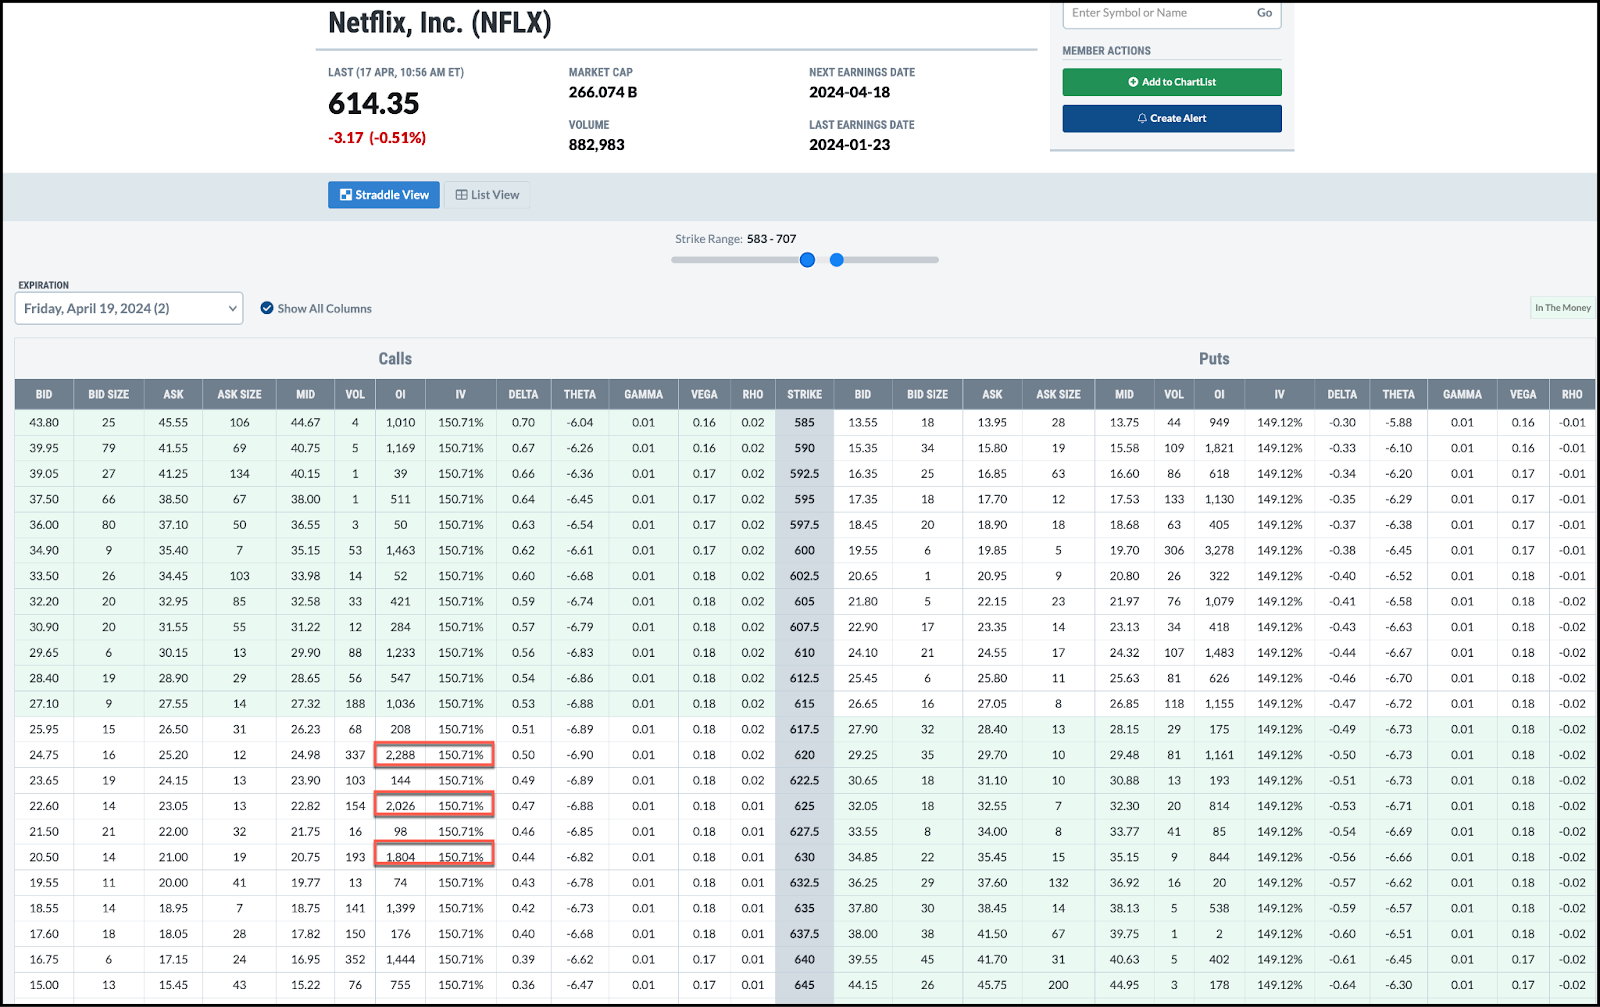
FIGURE 3. OPTIONS DATA FOR NFLX. Options expiring on April 19 show high IV, with the out-of-the-money call options showing increased trading activity.Chart source: StockCharts.com. For educational purposes.
The bottom line: Expect a lot of volatility in NFLX after the market closes on Thursday. If you're considering adding NFLX to your portfolio, wait until the price settles after the earnings announcement.
 Learn More. Want to trade options to generate additional income or hedge your portfolio holdings? Check out this video.
Disclaimer: This blog is for educational purposes only and should not be construed as financial advice. The ideas and strategies should never be used without first assessing your own personal and financial situation, or without consulting a financial professional.
Happy charting!


