TAKEAWAYS
- RIOT may be a beaten-down stock, but it has potential to rise higher
- A breakout above key the $12.65 price range on momentum could mean the stock price would move higher
- A potential resistance level is the $18.30 level

If you're not familiar, Riot Platforms (RIOT) is a leading Bitcoin mining company that generates revenue by mining and expanding its mining capacity. Its stock dropped by 30% year-to-date, despite reporting record Q1 2024 earnings earlier in the month for its Q1 2024 results.
The company is expanding its mining capacity, aiming to triple its hash rate by the end of the year. Still, given the associated costs and the recent Bitcoin halving event, which present challenges, is its growth trajectory sustainable?
In a nutshell, this summarizes the fundamental outlook: it's a speculative stock. However, it's a popular one whose momentum is driven by sentiment, especially in the near-term. As a swing trade, it might be worth the attempt. So let's take a closer look.
First, A Caveat
So why Riot Platforms? It has a crappy StockCharts Technical Rank (SCTR) score, and it's been fluctuating in a seemingly lifeless manner after having been beaten down quite significantly.
Well, the answer is that there's a lot of buzz surrounding the stock. Sometimes, buzz precedes giant moves. Not always, naturally, but, if you are attempting to get in early, paying attention to buzzy stocks with beaten-down prices and strong technical and fundamental potential is the first step toward finding the next big stock move.
Plus, you can check Riot's company profile using StockCharts Symbol Summary for technical and fundamental info. For example, note how RIOT's recent earnings performance tends to outperform analyst expectations. There are more things to check, of course, but this is just a sample of the full-spectrum info you can glean from this StockCharts tool.

The Macro Picture

CHART 1. WEEKLY CHART OF RIOT AGAINST BITCOIN. Riot's performance, driven by Bitcoin prices, is trailing well below it. A bearish sign, but can it turn around?Chart source: StockCharts.com. For educational purposes.
This image shows Riot's past and current performance. It exploded upward in 2021, driven primarily by Bitcoin prices to which it was tightly correlated, more or less. As both assets bottomed toward the end of 2023, Bitcoin prices skyrocketed while remaining locked within a range. Ultimately, RIOT began underperforming Bitcoin for weeks; it's currently -55% below Bitcoin's performance.
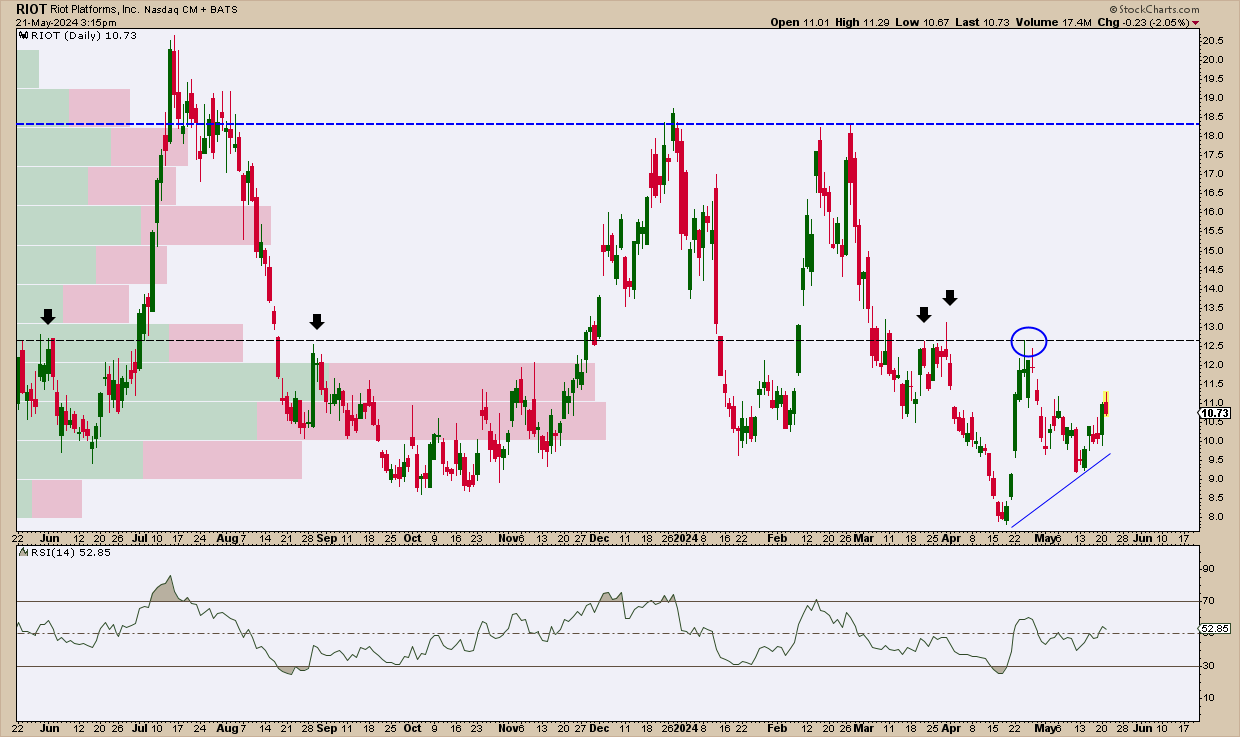
CHART 2. DAILY CHART OF RIOT. A beaten-down stock with strong technical and fundamental prospects?Chart source: StockCharts.com. For educational purposes.
If you're looking to take advantage of a short-term upswing, the key levels to watch center around the $12.65 price range. This resistance level has been tested on several occasions (at least) since June of 2023 (see black arrows). A breakout above this level would also clear the price range where heavy back-and-forth range trading occurred, as indicated by the Volume-By-Price indicator.
The Relative Strength Index (RSI), rising from "overbought" to just above 50, suggests that price potentially has more upside to go if momentum carries it upward. This correlates with the most recent swing low (see blue trend line), which failed to challenge its yearly low of just under $8 a share.
If the price breaks above $12.65 on strong momentum, look toward the $18.30 range as a potential selling level. This level marks a pair of significant highs and is also the average 12-month price target among several analysts.
The Takeaway
Riot Platforms is a leader in the emerging Bitcoin mining industry. Despite its struggles, the company has promising growth potential, and analysts are overall upbeat about its prospects.
More importantly, the buzz around the stock suggests it could see significant short-term gains, even if such a trade is driven more by sentiment and technical expectations. So keep an eye on the key price levels, which, given the green light, signal the opportunity to carefully capitalize on the upside (should it occur).

Disclaimer: This blog is for educational purposes only and should not be construed as financial advice. The ideas and strategies should never be used without first assessing your own personal and financial situation, or without consulting a financial professional.
Happy charting!


