TAKEAWAYS
- Consumer Staples stocks offer stability and growth in a high inflation environment.
- Many consumer staples stocks have exceeded analyst price targets, revealing Wall Street's underestimation of their growth potential.
- Sometimes the next big stock is often found in a seemingly boring name, as Sprouts Farmers Market has shown.

While wealthier consumers benefit from higher stock and real estate valuations, lower-wage Americans are crushed by high prices, and many fall behind in credit card debt. Meanwhile, the Fed has been telegraphing that inflation may be much stickier than initially expected.
Still, consumers have to shop for basic staples, like groceries. If inflation persists, investing in staples makes sense. But large retailers that are also go-tos for "grocery" items are uniquely diversified, and their operations are differentiated and complex.
When considering major Consumer Staples sector companies such as Walmart (WMT), Costco (COST), Sprouts Farmers Market (SFM), and Kroger (KR), it's important to note that Walmart and Costco are generally categorized under "General Merchandise Stores" or "Discount Stores." In contrast, Sprouts and Kroger are categorized specifically under "Food Retailers." However, all four companies compete in the grocery space—a vital arena considering today's inflationary climate.
So, in light of this common ground of competition, how might you determine which companies might be more favorable/investible than the next?
The Four Retailers At–a-Glance
A big-picture glance at all four stocks using StockChartsACP Layouts shows that WMT, COST, and SFM are all exhibiting strong uptrends and have notched record highs. KR is the only stock among the four currently pulling back, having failed to challenge its 2022 high of $59.70.
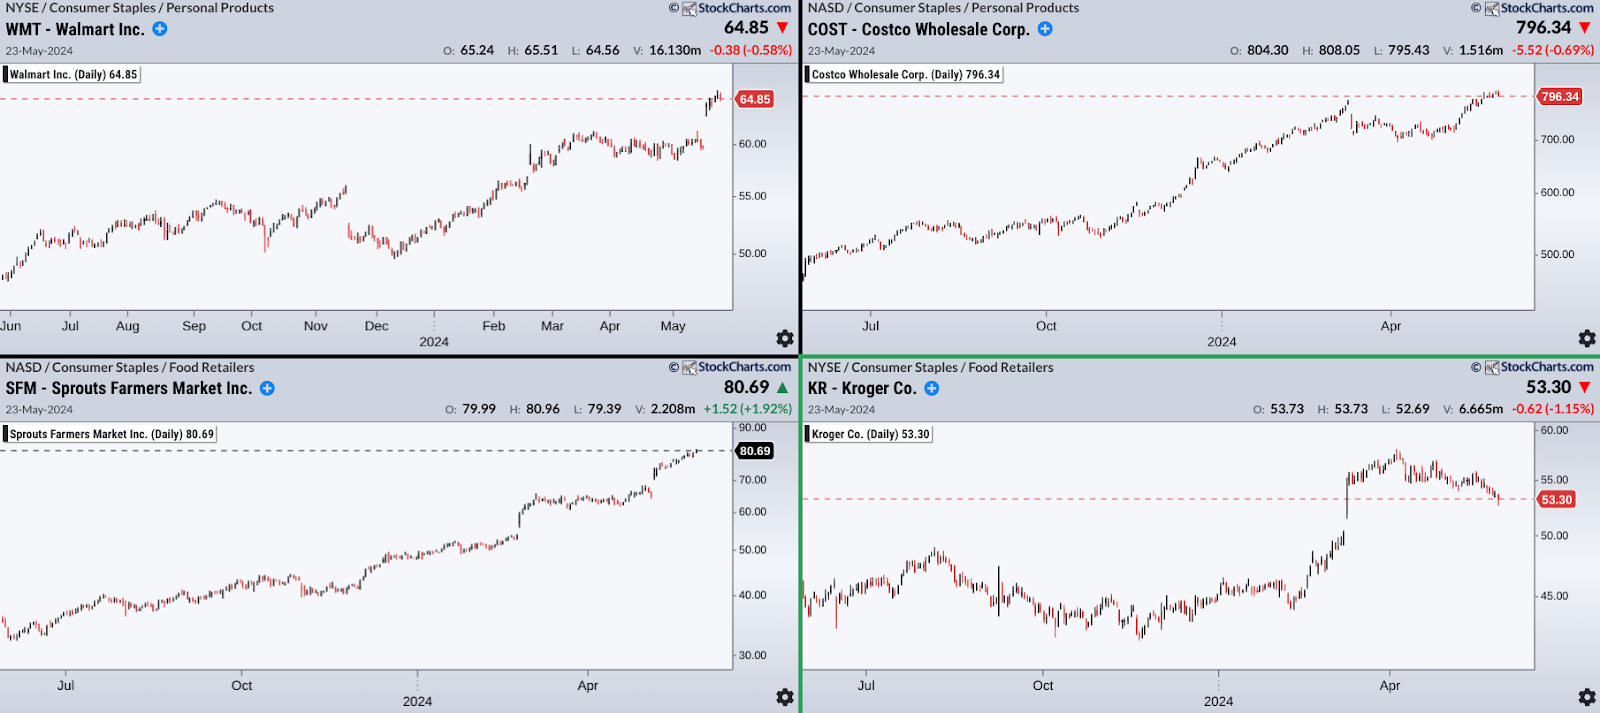
CHART 1. DAILY CHARTS OF WALMART, COSTCO, SPROUTS FARMERS MARKET, AND KROGER. WMT, COST, and SFM are in all-time high territory while KR is dipping.Chart source: StockChartsACP. For educational purposes.
Walmart Gaps Up, But Can It Sustain Its Upward Momentum?
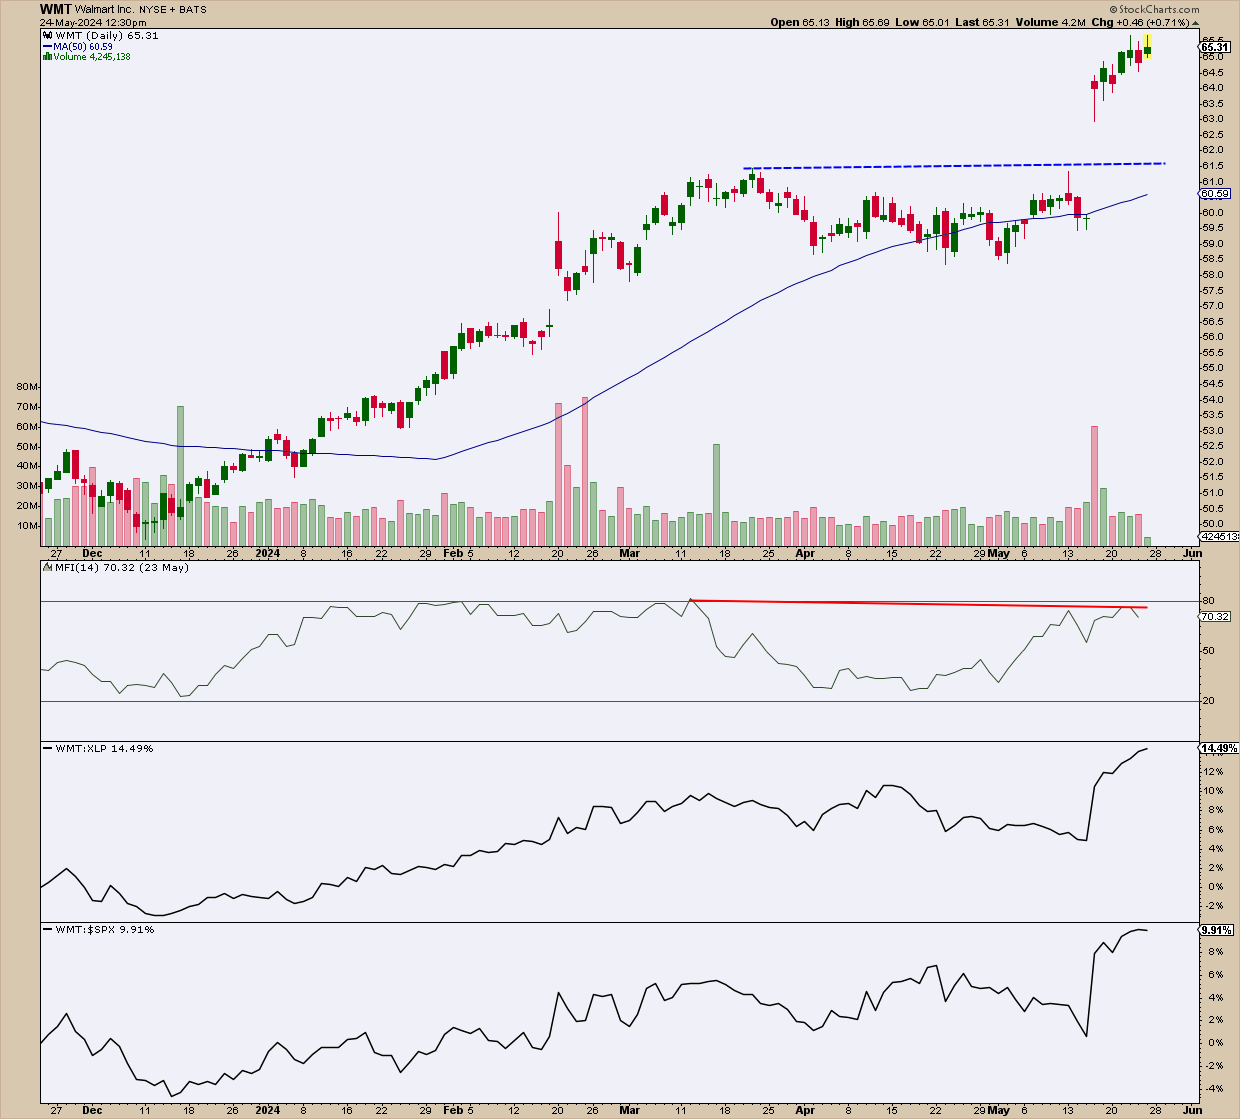
CHART 2. DAILY CHART OF WALMART. Note the breakaway gap with a strong historical tendency to keep moving higher. But where's the volume behind the move?Chart source: StockCharts.com. For educational purposes.
WMT exhibited a strong surge post-earnings by way of a breakaway gap, which, by the way, has a low probability of getting filled within a week (1%), according to technical analyst Thomas Bulkowki. Yet, if you look at the volume, which shows little follow-up, it's not the only indication that the stock may be due for a pullback. The Money Flow Index (MFI), a volume-weighted RSI, shows a flat-to-slightly-bearish diversion; its buying pressure falls as prices continue rising, indicating a potential pullback.
Still, its relative performance against the Staples sector (XLP) and the S&P 500 ($SPX) is relatively strong, nearly 15% and 10%, respectively.
Although runaway gaps tend not to get filled right away, other technical factors say it's bound to happen soon. Still, it's up in the air. And you'd have to weigh this against the fundamentally informed analyst targets (and overall economic situation) to determine whether it's a strong investment.
Costco is Skyrocketing Higher
Costco's performance in comparison to its sector and the S&P 500—27% and 22%, respectively—is notable, but not exceptional. However, the MFI shows the stock is in overbought territory with a slight bearish divergence. This indicates that the buying pressure that has driven its valuation may be weakening. If COST experiences a pullback, it may find support at previous swing highs of $775.75 and $750.
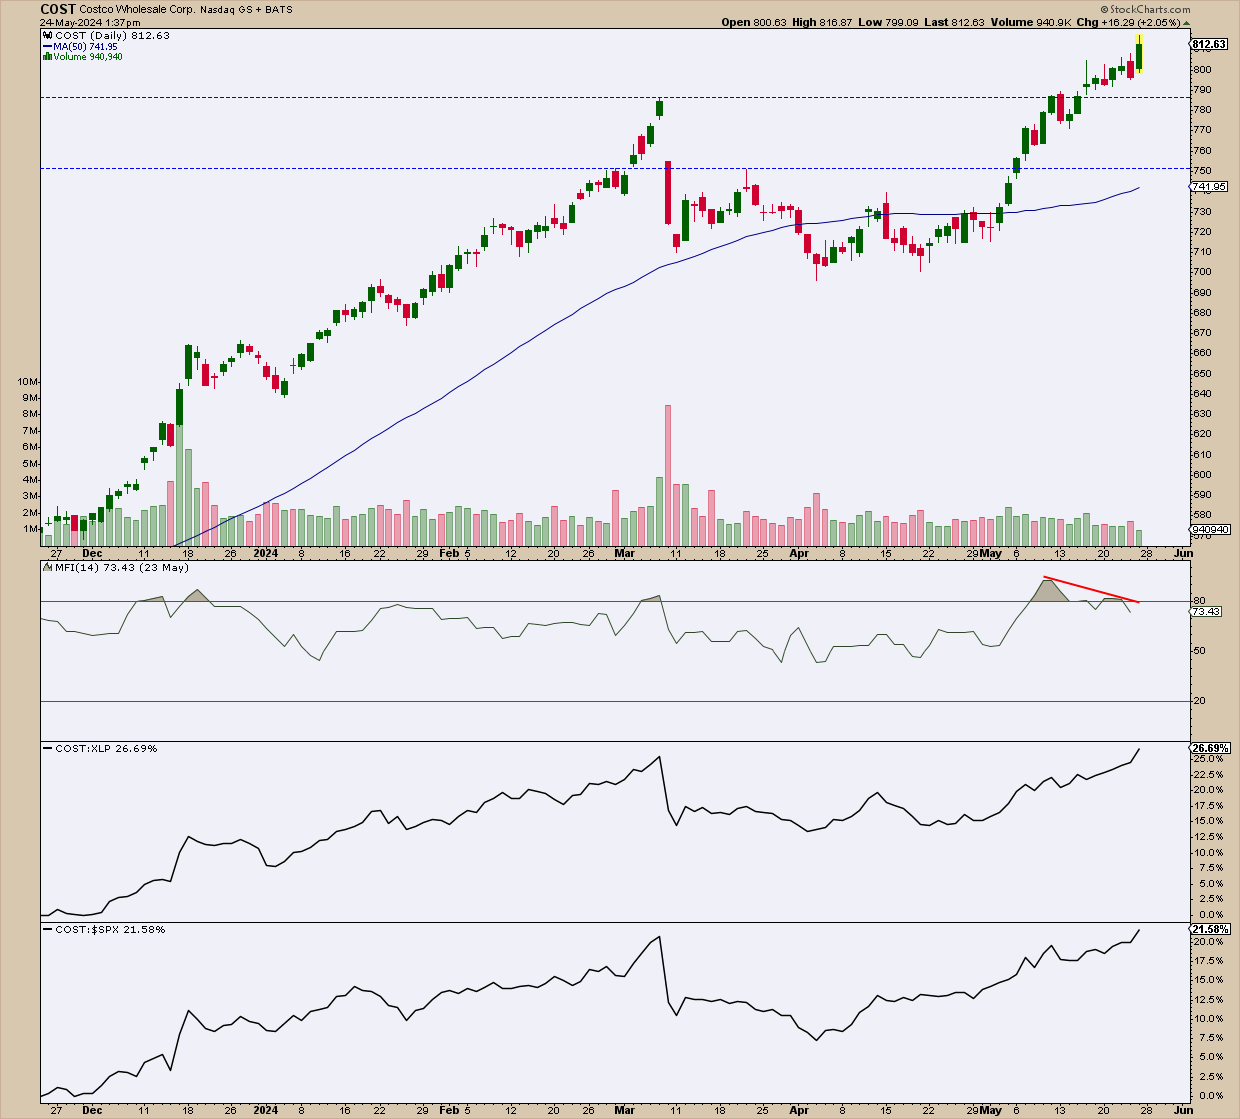
CHART 3. DAILY CHART OF COSTCO. COST is surging ahead, yet watch out for the dwindling volume.Chart source: StockCharts.com. For educational purposes.
Sprouts Farmers Market's Steady Uptrend
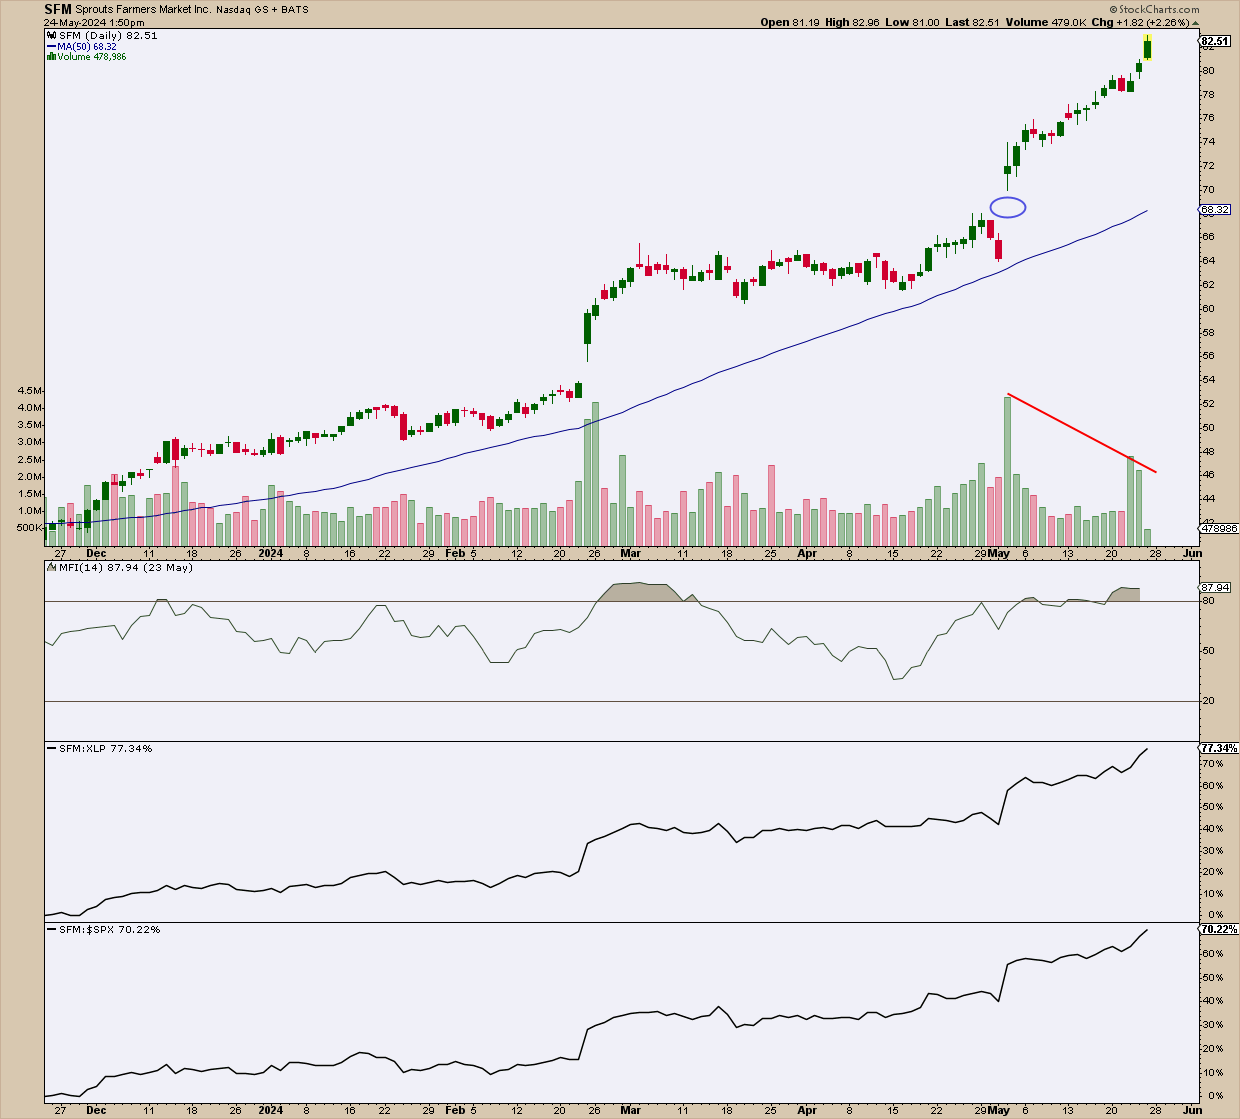
CHART 4. DAILY CHART OF SPROUTS FARMERS MARKET. Note that SFM, once a "hidden gem," is among the most impressive performers in the staples sector.Chart source: StockCharts.com. For educational purposes.
Also in all-time-high territory is SFM. Covered last December in the article Sprouts Farmers Market: A Hidden Gem on the Corner of Wall and Main Street?, SFM's rally turned out to be one of the more impressive performers in the sector. It's outperforming its sector by nearly 78% and the S&P by a little over 70%, making it the strongest performer among the four in this article.
While SFM has entered "overbought" territory once again, and its decreasing volume doesn't appear that it can sustain its rally without a pause, SFM is likely to continue surprising Wall Street in the quarters to come. So, it's a stock you might consider after a favorable pullback and a strong indication of a bullish reversal.
Kroger: A Pullback or Reversion?
Kroger is the weakest performer among the four discussed in this article. Its most recent high at $59 is a third retest of its $59.70 high in 2022, after which, as you can see, it failed. However, if you are bullish on Kroger, or if you're looking to accumulate it as part of a diversification strategy, you might want to wait for it to pull back to its 50% Fibonacci retracement level near the $51 range.
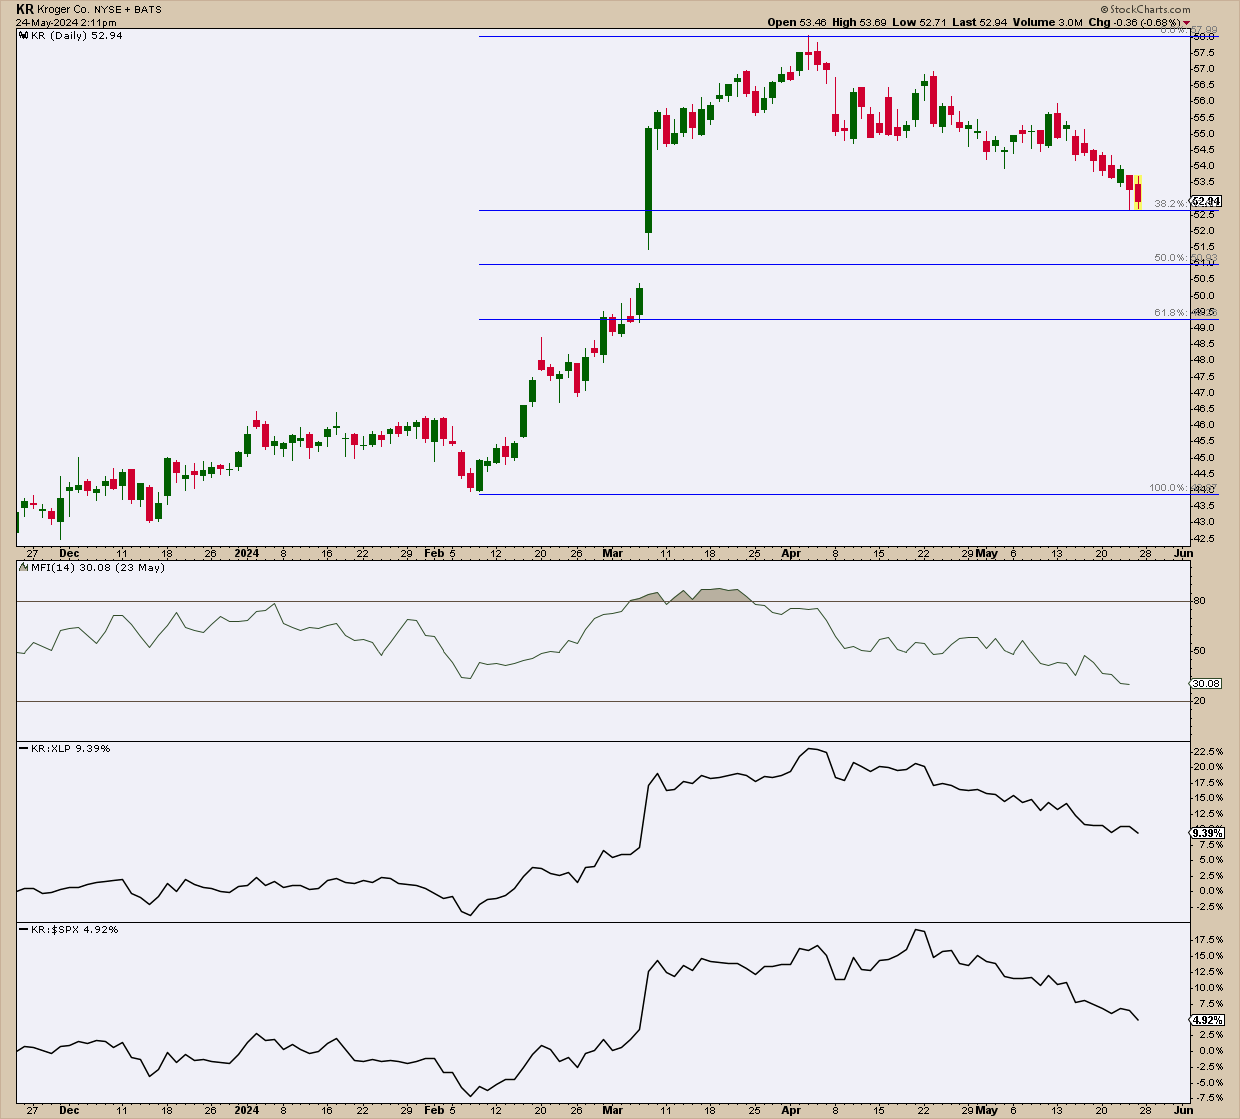
CHART 5. DAILY CHART OF KROGER. Is there still a reason to be bullish on KR? It's the worst performer of the bunch. But if you want to accumulate KR, it's approaching a reasonable buy level.Chart source: StockCharts.com. For educational purposes.
The Takeaway
Staples stocks might not be glamorous, but in a high-inflation environment, some of these seemingly boring stocks turned out to be the hottest performers on Wall Street. Major players like Walmart, Costco, Sprouts Farmers Market, and Kroger benefit from persistent demand for groceries. Notably, Walmart, Costco, and Sprouts are hitting all-time highs, while Kroger is lagging. Interestingly, 2024 analyst targets for these stocks have often been exceeded, highlighting Wall Street's underestimation of their potential.

Disclaimer: This blog is for educational purposes only and should not be construed as financial advice. The ideas and strategies should never be used without first assessing your own personal and financial situation, or without consulting a financial professional.
Happy charting!


