TAKEAWAYS
- Following the CrowdStrike debacle, the stock is as much a technical trade as it is a news-driven trade
- Crowdstrike's stock price has entered a potential buying zone, but potential lawsuits may be a headwind
- Crowdstrike could be a buying opportunity but watch momentum, buying levels, and news updates

Almost everyone felt the ground shake on July 19 when security vendor CrowdStrike (CRWD) initiated a faulty software update that caused a Windows systems failure worldwide, and millions of screens displaying the infamous blue screen of death (a.k.a. BSOD). Crowdstrike's stock price fell 11% on Friday and dropped further by over 13% on Monday.
I was supposed to check in for a United Airlines flight the day following the incident when I suddenly received an alert that my flight had been canceled. It took only a second to learn that CrowdStrike was responsible for the mess.
Preparing for a Crowdstrike News Trade
If you've been watching the market, you might have guessed that CRWD would take a hit while its rival, Palo Alto Networks (PANW), got a boost. CRWD, the second-largest cybersecurity company in the US, had decent fundamentals. But, the big question is how it will handle the looming customer lawsuits.
If you're bullish on CRWD and think it will recover from its debacle (which isn't over, btw), its recent drop presents a prime buying opportunity. Let's assume this is what you're looking for. Here are the key levels to watch.
CrowdStrike: Key Levels to Watch
Looking at CrowdStrike's daily chart, you can see that before the July 19 slip-up, CRWD was already overextended (check the black dotted lines). This was evident in the Relative Strength Index (RSI) and the Chaikin Money Flow (CMF).
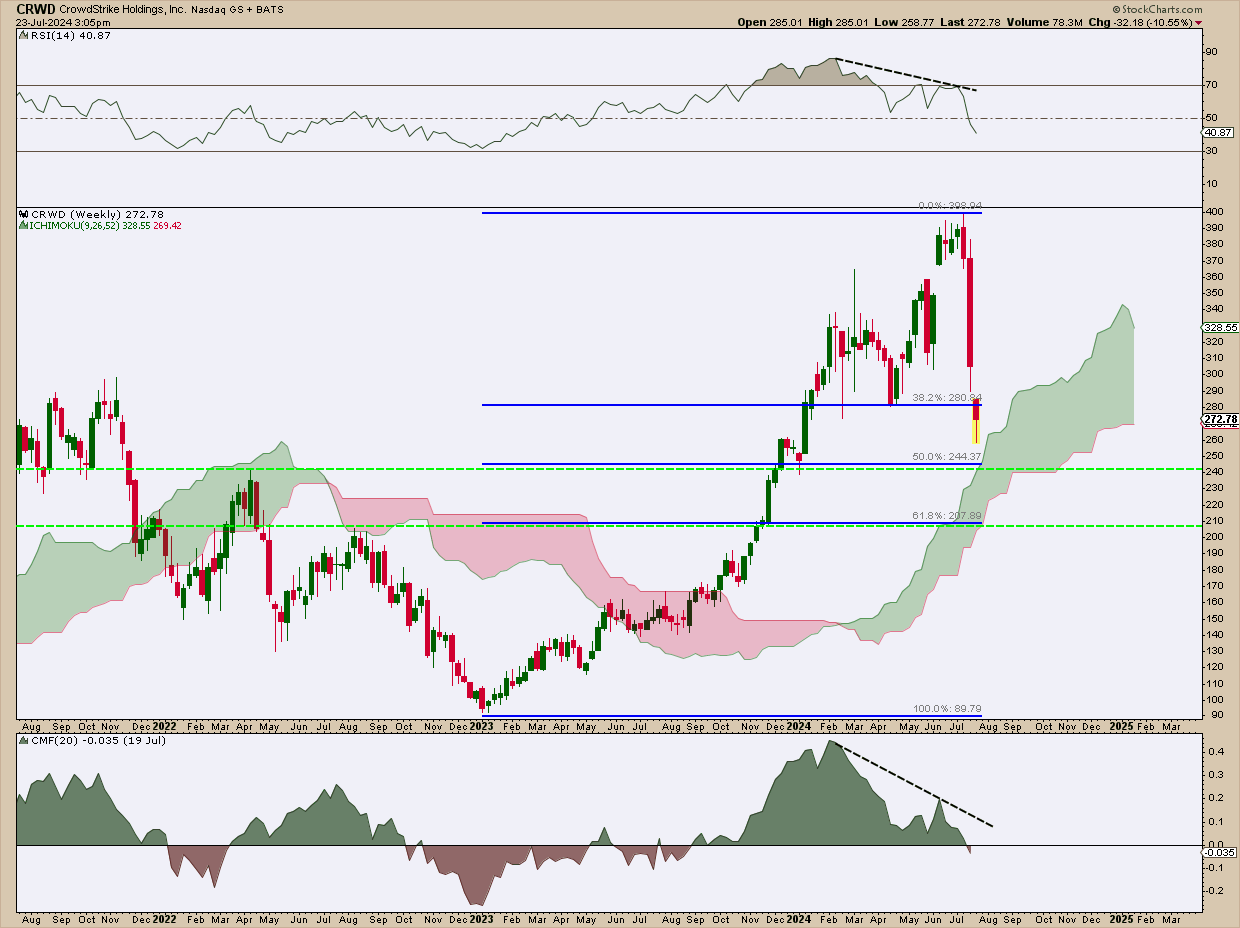
Although this is an important "technical" indication, you'll want to keep an eye on it, because it will be compounded by even more negative media coverage (as in stories of ongoing failures, commercial impact, potential lawsuits, etc.).
As long as you keep that in your sights, take a look at the Fibonacci Retracement levels (in blue) and the support/prior resistance lines (green dotted lines). Buyers jumped in at $245 where the 50% Fib and upper support lines converged. Should the price continue to slump, the range between $245 and $207, where the 61.8% Fib line and second support level converge, serves as a strong buying point.
The Ichimoku Cloud not only gives you a picture of the projected uptrend (should it continue) but also a range for potential support on the higher end of the price action. If the price falls below $207, you will have to reassess the technical, fundamental, and news-driven context.
The Close
While CRWD, the second-largest US cybersecurity company, faces challenges and potential lawsuits, its recent stock dip might be a buying opportunity for the optimistic. Keep an eye on momentum, the buying levels, and the news updates. Things can get a lot better or a lot worse for the company in the weeks to follow.
P.S. Grayson Roze's ChartWatchers Post on CrowdStrike
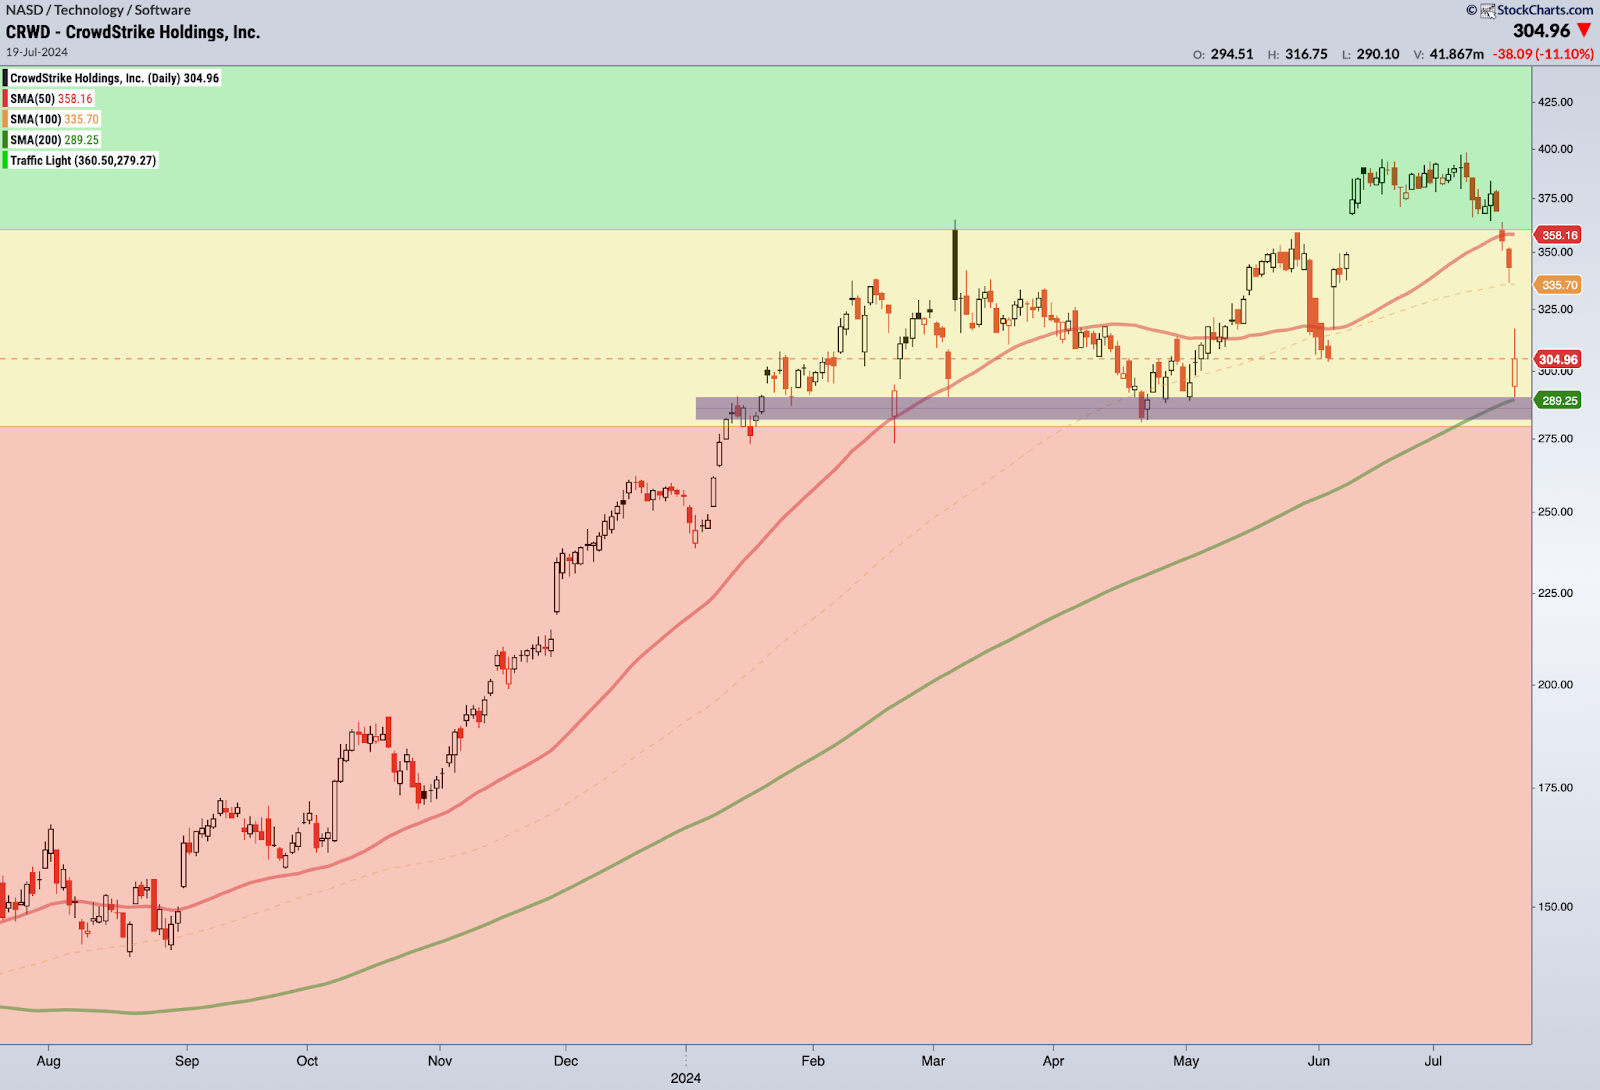
CHART 2. GRAYSON ROZE'S TAKE ON CROWDSTRIKE'S PRICE ACTION.
Grayson Roze is eyeing the chart and thinking, "Is this a massively bullish moment for CRWD?" The stock just bounced off prior resistance-turned-support and its 200-day MA in a longer-term uptrend. If this bottom holds, we could see a bullish formation. CrowdStrike's recent chaos, taking half the internet offline, shows its critical role like Amazon or Google. Roze uses the Traffic Light indicator on ACP, marking bullish, bearish, and neutral zones, to set thresholds based on his analysis.

Disclaimer: This blog is for educational purposes only and should not be construed as financial advice. The ideas and strategies should never be used without first assessing your own personal and financial situation, or without consulting a financial professional.
Happy charting!


