TAKEAWAYS
- In June, Gilead Sciences saw a dramatic surge as positive results of a late-stage trial of its HIV drug had Wall Street buzzing.
- GILD was a "sentiment trade" that spiked too quickly for most technical and fundamental indicators to make heads or tails of the move.
- Key support levels created a prime "ground level" buying opportunity.

In late June, Gilead Sciences (GILD) stock surged following positive results of a late-stage trial for its latest HIV drug.
The big market buzz was that Gilead was on the verge of something huge, and investors were not about to wait around for proof. They dove in early, seeing the price jump as a prime "ground floor" opportunity.
Expecting a pullback, given the speculative nature of the spike, there were key levels where a bounce could occur, providing an opportunity for you to ride Gilead's momentum, even if just for a swing trade. The bullish thesis worked out, so let's examine what happened.
What Happened and Where's GILD Going?
The Gilead chart below zooms in on the price action following the trial results. The big unknown at the time was whether the spike on June 20 was going to pull back, and whether a pullback would end the uptrend.
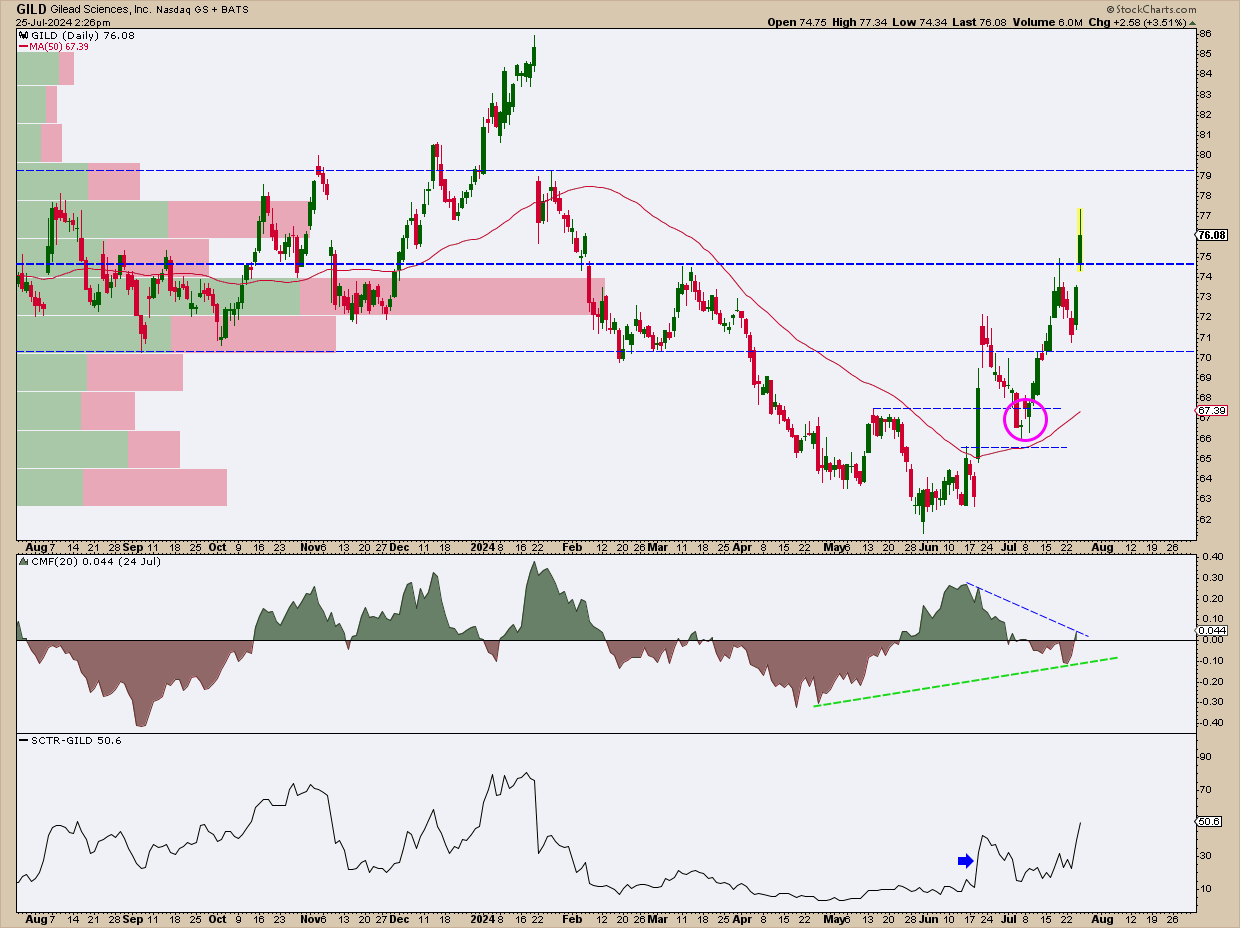
CHART 1. DAILY CHART OF GILEAD SCIENCES. The stock price pulled back, and the levels projected in June have so far held. Chart source: StockCharts.com. For educational purposes.
Before the Pullback in the Stock Price
What made this decision point particularly difficult were the following:
- A StockCharts Technical Rank (SCTR) score of 30 (see blue arrow) wasn't by any means promising, but from a bullish perspective, it also meant the potential for a ground-floor entry.
- The Chaikin Money Flow (CMF) indicated that buying pressure was fading (see blue dotted line in the CMF indicator window), suggesting a pullback or resumption of the downtrend.
With strong bullish sentiment hinging on an upcoming FDA trial and shaky technicals aside from a solid breakout, a long trade might have felt like a coin toss, one slightly favoring the bulls. Hence, the importance of the key levels $68 and $66 and the 50-day simple moving average (SMA).
After the Pullback in the Stock Price
Let's zoom in to the same chart above.
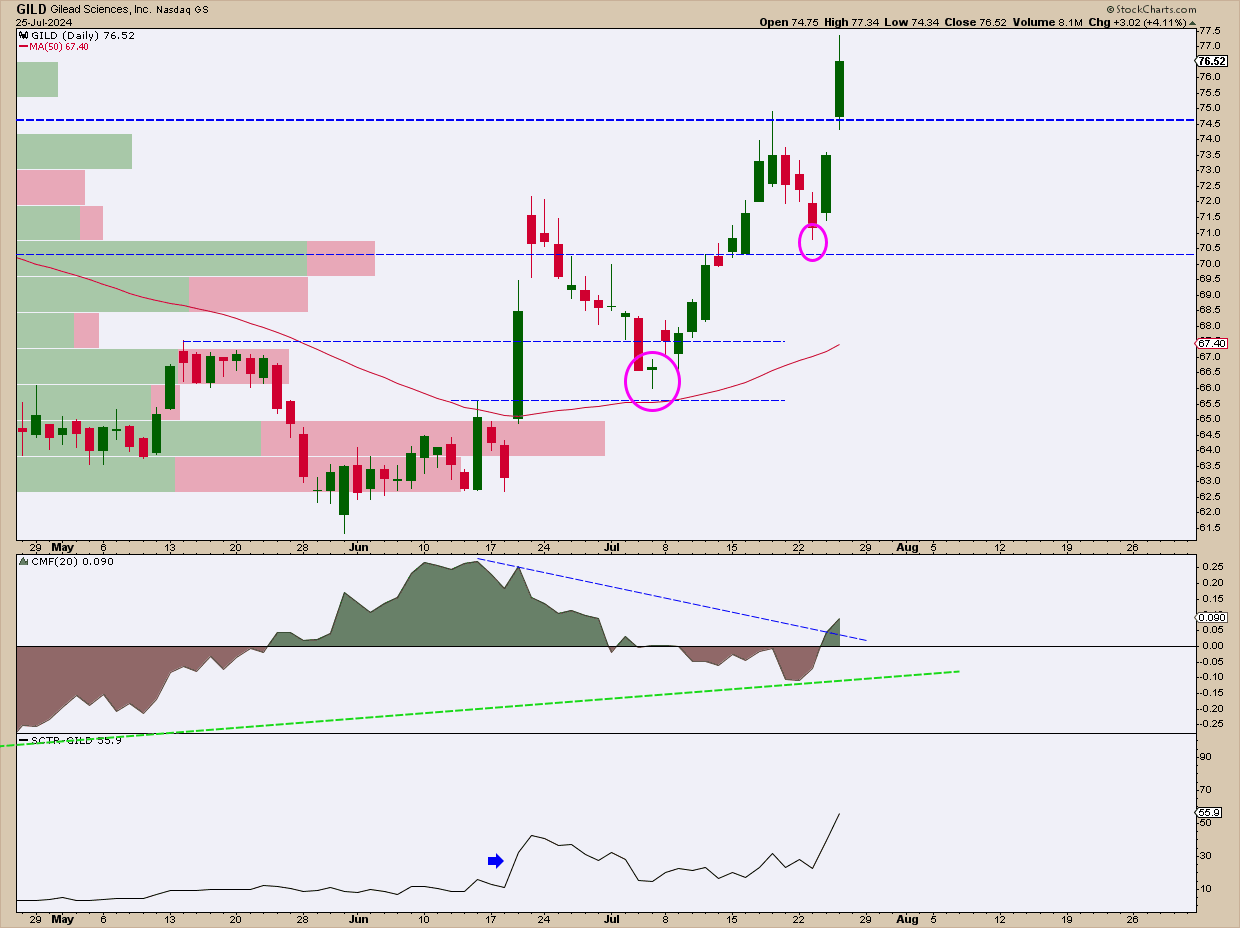
CHART 2. DAILY CHART OF GILEAD SCIENCES. Here, you can see the exact entry points and how prices respected the levels. Chart source: StockCharts.com. For educational purposes.
Here, you can see that the $66 support level converged with the 50-day SMA. GILD respected this level as buyers jumped in, anticipating a bounce, which they did get. Although the CMF entered negative territory, you can see how selling pressure began to fizzle out, and buying pressure overtook the bears.
As prices took out the June high, its pullback respected the $70.50 level (see second magenta circle), launching GILD to take out critical resistance right below $75 (see heavy blue dotted line).
The question is whether, upon a third pullback, the stock price will respect support at $75 and surge to (or beyond) $79.
At the Close
You might be wondering if GILD is still a buy. It was a buy (emphasis on "was"), as the price action presented an ideal opportunity on the ground level. If you're a longer-term investor, it would be wise to wait and see how GILD fares in light of its final testing period and FDA review process.
If anything, the June GILD scenario underscores the importance of acting on key levels when the market flashes a fleeting opportunity amidst drastic (and bullish) fundamental and technical shifts.

Disclaimer: This blog is for educational purposes only and should not be construed as financial advice. The ideas and strategies should never be used without first assessing your own personal and financial situation, or without consulting a financial professional.
Happy charting!
