TAKEAWAYS
- SMH has completed 100% of a measured move from the bottom of a double-top reversal.
- SMH has broken below several key levels based on various indicators.
- There are actionable levels in the SMH chart that traders can take advantage of if they materialize.

Nvidia (NVDA) was perhaps the most outstanding semiconductor trade of 2024. While some people might have missed out, there are still plenty of chances to get in.
But it's also wise to look for a diversified alternative. And to that end, the trade that's flashing a potential opportunity is the VanEck Vectors Semiconductor ETF (SMH).
Why Consider Investing in SMH?
SMH has outperformed the S&P 500 ($SPX) over the last 10 years. It's deeply diversified within the cyclical semiconductor space, and it carries exposure not only to top-quality chip stocks but also to those on the cutting edge of the AI industry.
SMH: Four Ways to Look At It
SMH has broken below the measured move of a double-top reversal. Does this present a threat of further downside or an opportunity to buy the bounce?
The fundamental bias is bullish on long-term tech and AI demand. The technical bias, also bullish, is toward finding areas of support for a potential buy.
Here are four ways to look at it:
1—SMH: Analyst Price Targets for 2025
Based on several rating sites, analyst price targets for SMH in 2025 are as follows (you can follow this ACP chart by clicking here).
High Estimates
- $451.50
- $380.60
Average Estimates
- $357.32
- $300.68
Low Estimates
- $263.14
- $227.98
2—SMH: Simple Moving Averages and Support
Looking at the chart below, SMH blasted through both the 50-day and 100-day simple moving averages (SMAs). Reading the price action from a swing trader's perspective, those who went short at the bottom of the double-top formation likely covered their positions upon reaching 100% of the measured move near the 100-day SMA. That probably accounted for the bounce.

CHART 1. DAILY CHART OF SMH. The 50, 100, and 200-day simple moving averages are still in "full sail."
But if you look at the last four candles, you can see that the July 30, 2024, candle took out the bottom of the last swing low (three sessions prior). This tells you that neither the near-term swing low nor the 100-day SMA will likely serve as reliable support levels.
While the Chaikin Money Flow (CMF) tells you that selling pressure prevails, the Relative Strength Index (RSI) also hints at the possibility that the current move may dip into "oversold" territory. Might this indicate a potential bounce? If so, might you have to wait until SMH approaches the 200-day SMA before seeing a strong reversal candle and a change in momentum?
3—SMH: Ichimoku Cloud and Volume-by-Price
Looking at the chart below, the Ichimoku Cloud projected a thickening bullish range of support but now looks to be turning red. Plus, price pierced the bottom of the cloud, which suggests bearish.
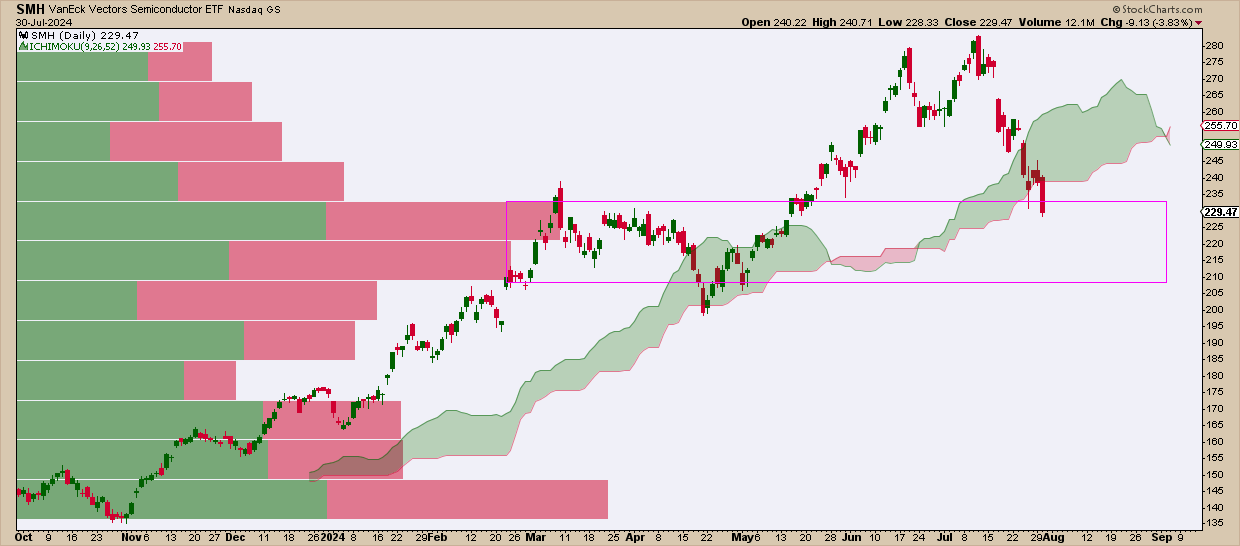
CHART 2. DAILY CHART OF SMH WITH ICHIMOKU CLOUD AND VOLUME-BY-PRICE. This gives a better indication of a potential range of support.
But since the cloud is plotted to indicate range, this scenario is somewhat tempered by the Volume-by-Price indicator, which, too, offers a way to view a potential zone of support (and resistance) by way of strong areas of concentrated market activity. According to it, SMH has just entered a strong zone of prior market action. Whether there will be a reversal within this range or a more contentious and congestive back-and-forth as bulls and bears aim to seize direction—this is something to watch. Dropping below this range may render it a resistance level, suggesting further downside.
Lastly, you might want to examine the price action from another angle, one that might give you a more specific reading of levels.
4—SMH: Short Term vs Long-Term Fibonacci Retracements
The chart shows two sets of Fibonacci retracements: A long-term Fib from the November 2023 low to the July 2024 high, and a short-term Fib from the April 2024 to the July high of the same year.
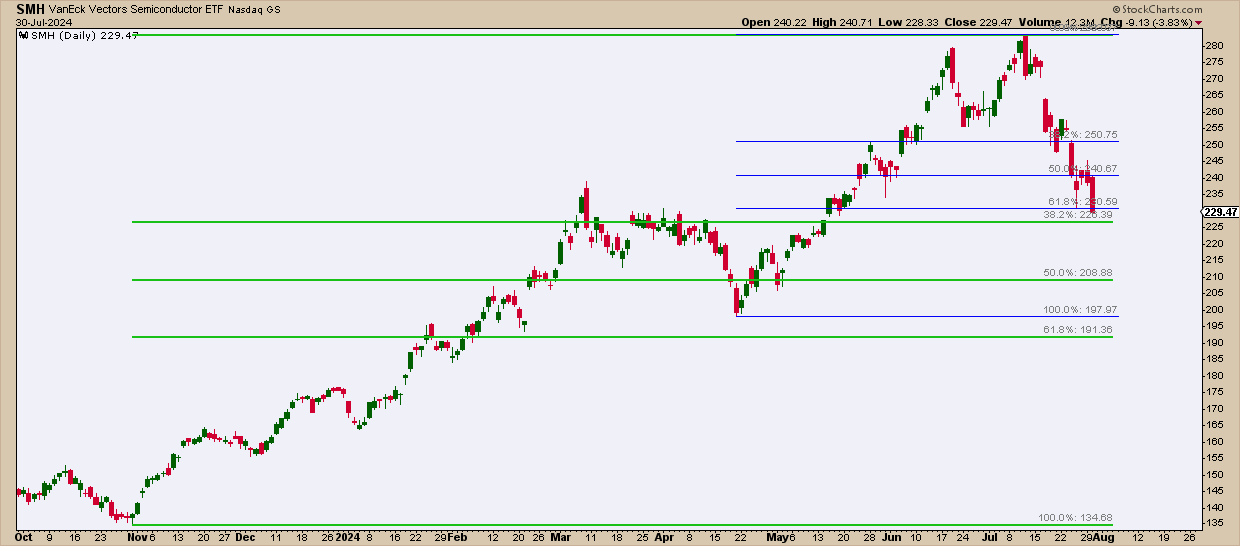
CHART 3. DAILY CHART OF SMH: Compare the short-term and long-term Fib retracements; both highlight a single actionable zone that aligns with the chart above.
Taking an educated guess on the action based on these levels:

- Short-term bulls attempted to enter at $230 as it coincided with the short-term 61.8% retracement level (which is arguably a favorable low entry point).
- The $230 price level also coincides with the longer-term Fib 38.2%, which, for longer-term traders, is an early buy point for those looking to get in on the long side.
- If the price can't hold above $230, then short-term traders may liquidate their positions, as this would invalidate the case for a short-term trade.
- Those with a longer-term perspective, however, would probably begin piling in at $210 which is where the longer-term 50% Fib level is located.
- $200 is a crucial support level, matching the April swing low. A drop below this would challenge any bullish outlook despite the 61.8% Fib level traditionally being a valid entry point below this price.
At the Close
The VanEck Vectors Semiconductor ETF (SMH) offers a compelling opportunity on the long side. Despite recent technical challenges, the fundamental picture remains bullish due to strong long-term demand for tech and AI. Plus, analyst price targets for 2025 are optimistic. However, there are specific price levels below which can invalidate such a bullish thesis. The bullish opportunity SMH presents presents itself at a vulnerable juncture, so keep an eye on those levels.
Disclaimer: This blog is for educational purposes only and should not be construed as financial advice. The ideas and strategies should never be used without first assessing your own personal and financial situation, or without consulting a financial professional.
Happy charting!


