Last Friday, as Apple (AAPL) soared once again, experience told me to start looking for any indications of exhaustion. The daily and weekly chart revealed nothing, but the monthly revealed something I had never seen before - and I have looked at millions of charts in the past 40 years. Apple has now made a monthly high above the 3rd Deviation Pivot up 5 months in a row. Staggered by what I saw, I ran a test over the weekend to see how often this had happened in the past. I took a database of 1800 U.S. stocks going back to 1990. Obviously, not all those stocks have been around that long, and I was unable to test stocks that no longer existed, but it still represented approximately 150k instances where it could have occurred.
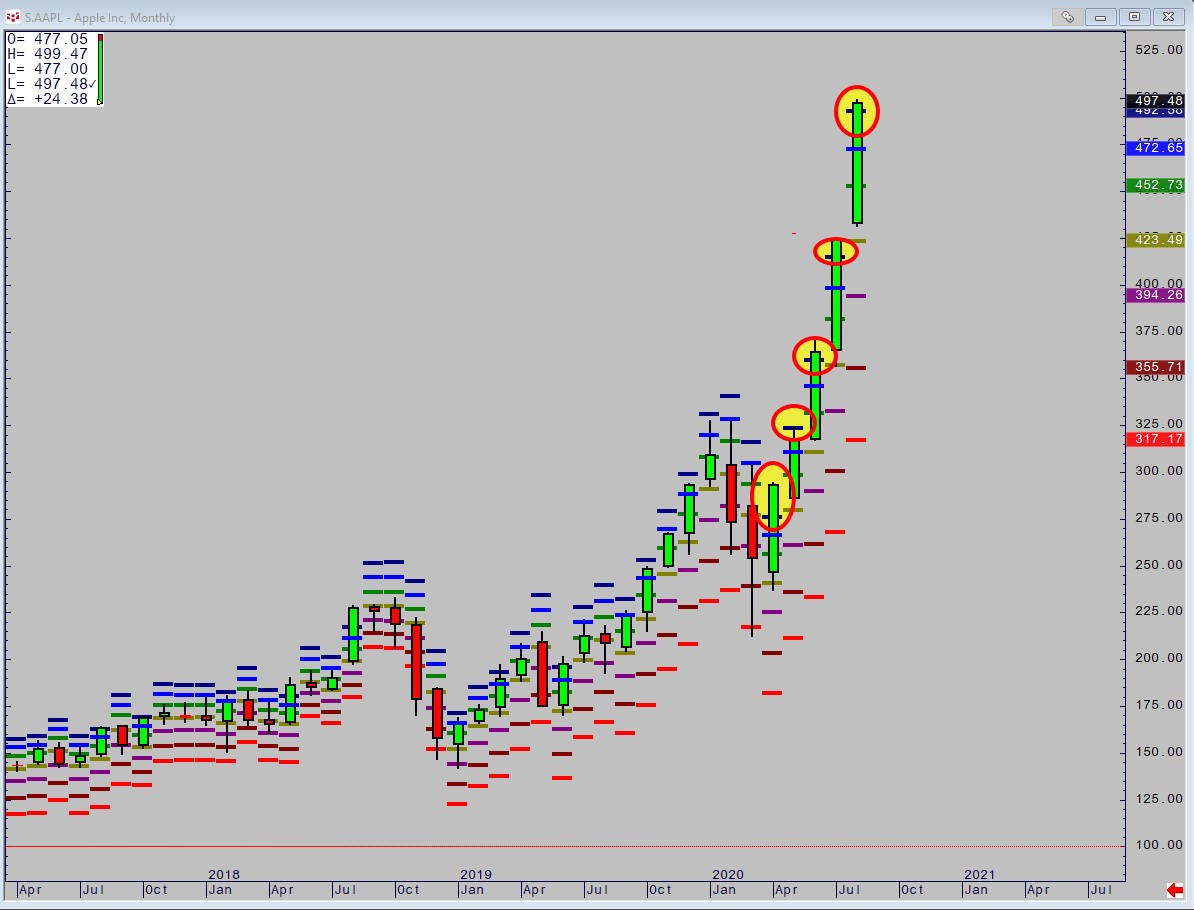 Apple Monthly
The rarity of what I thought I had seen was proven, as it has only happened 8 times and only once in the last 13 years.
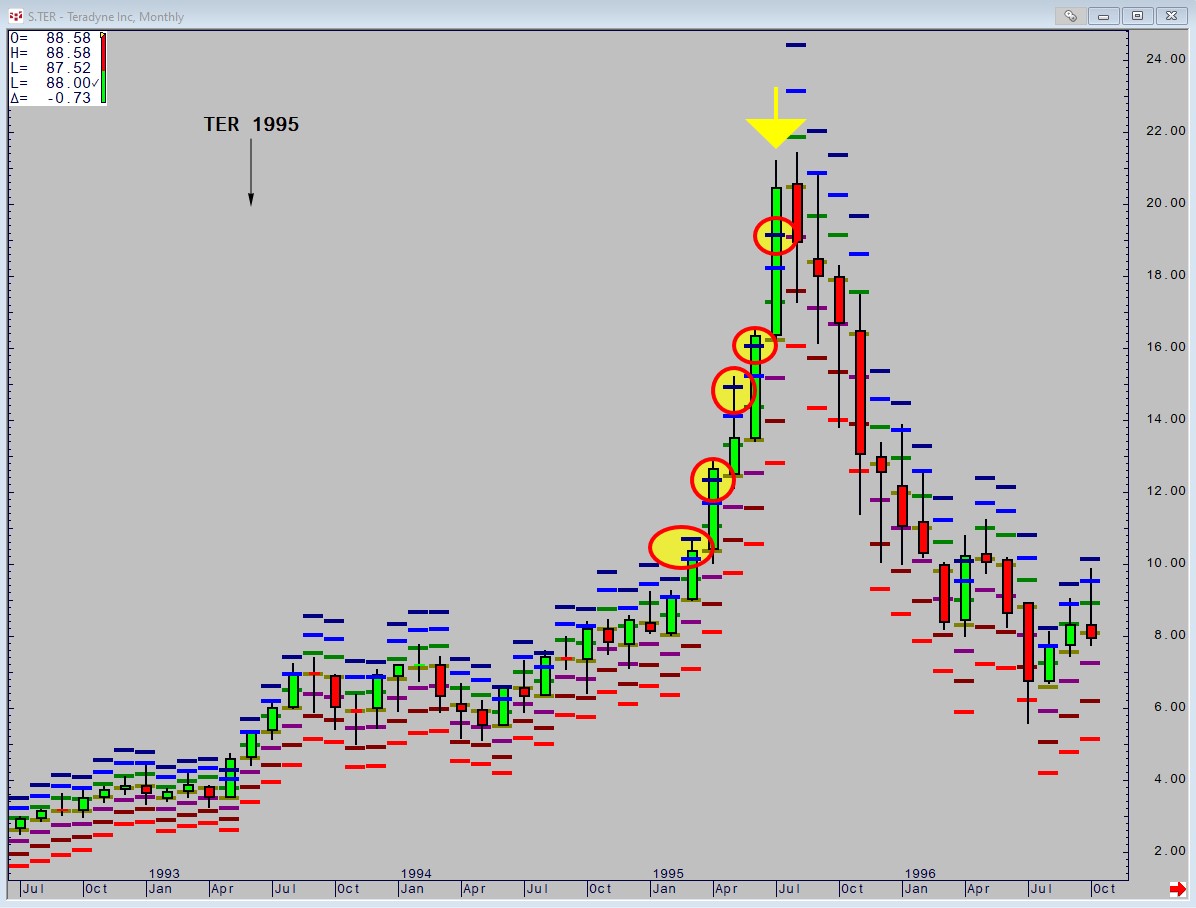
First up is TER in 1995:
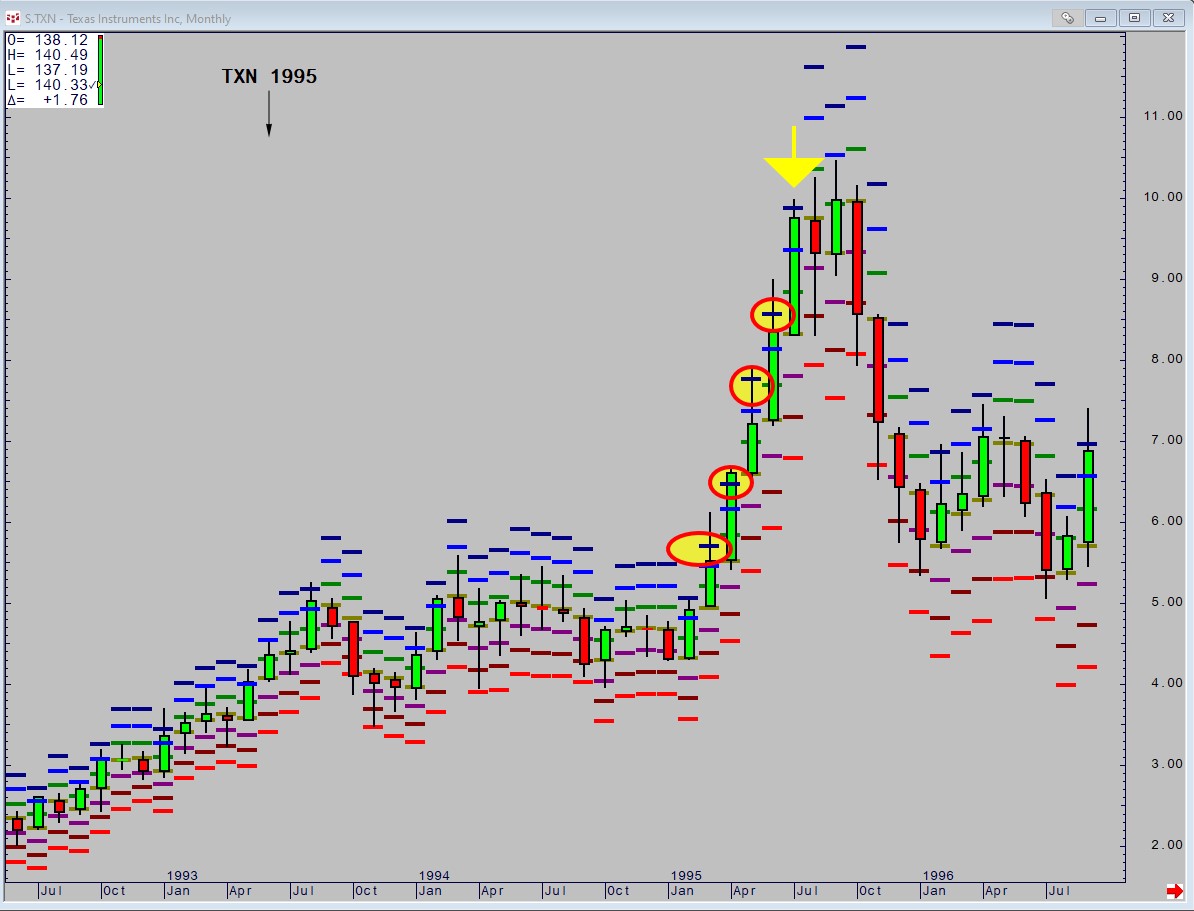
Next is Texas Instruments (TXN) the same year:
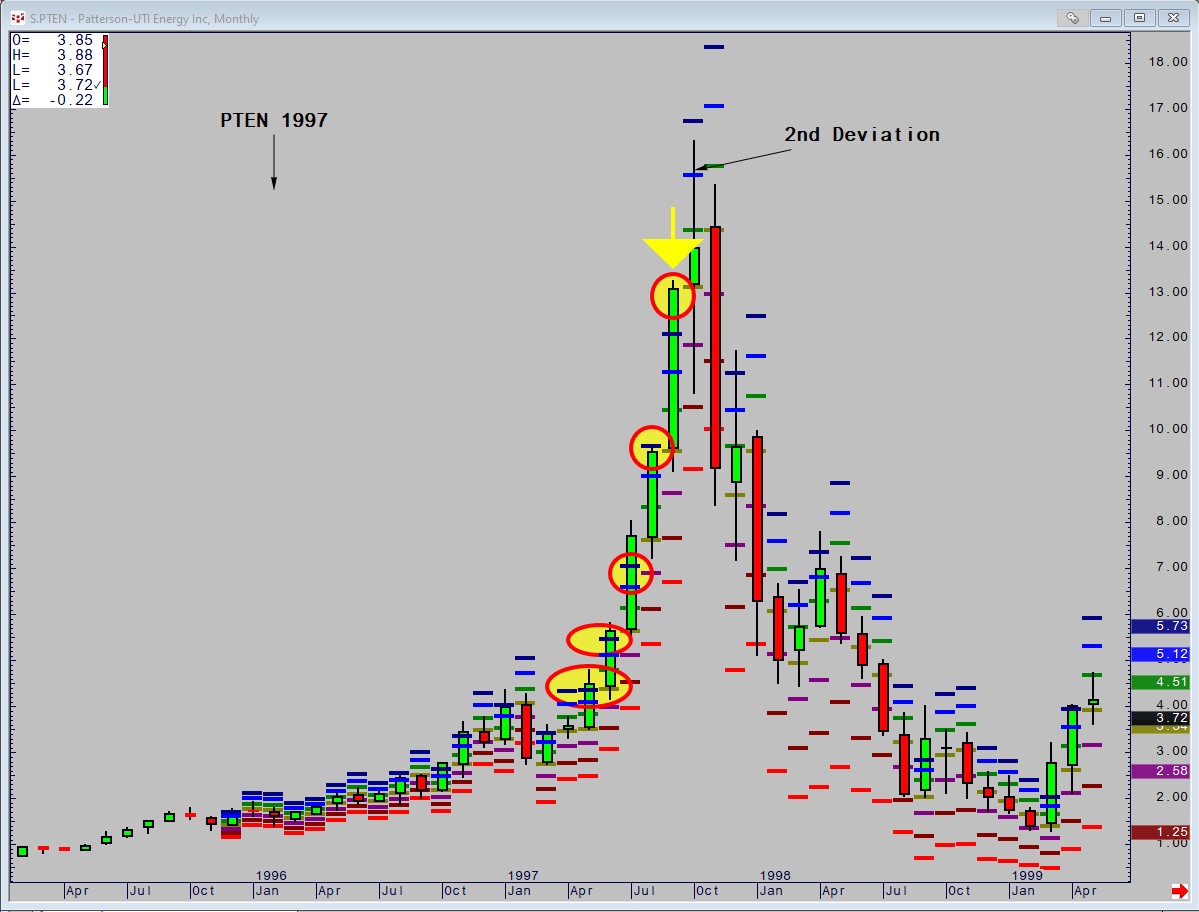
Then we have PTEN in 1997:
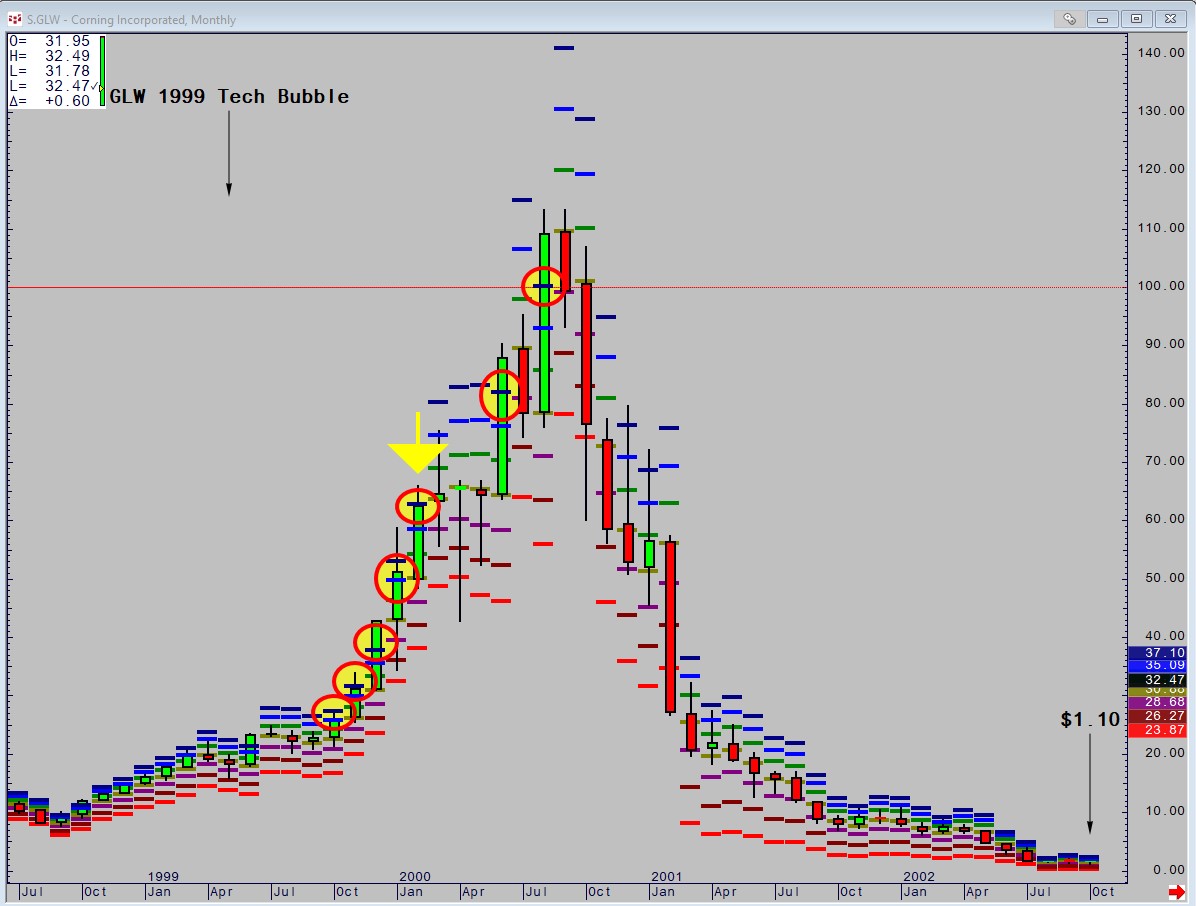
GLW in the 1999 Tech Bubble:
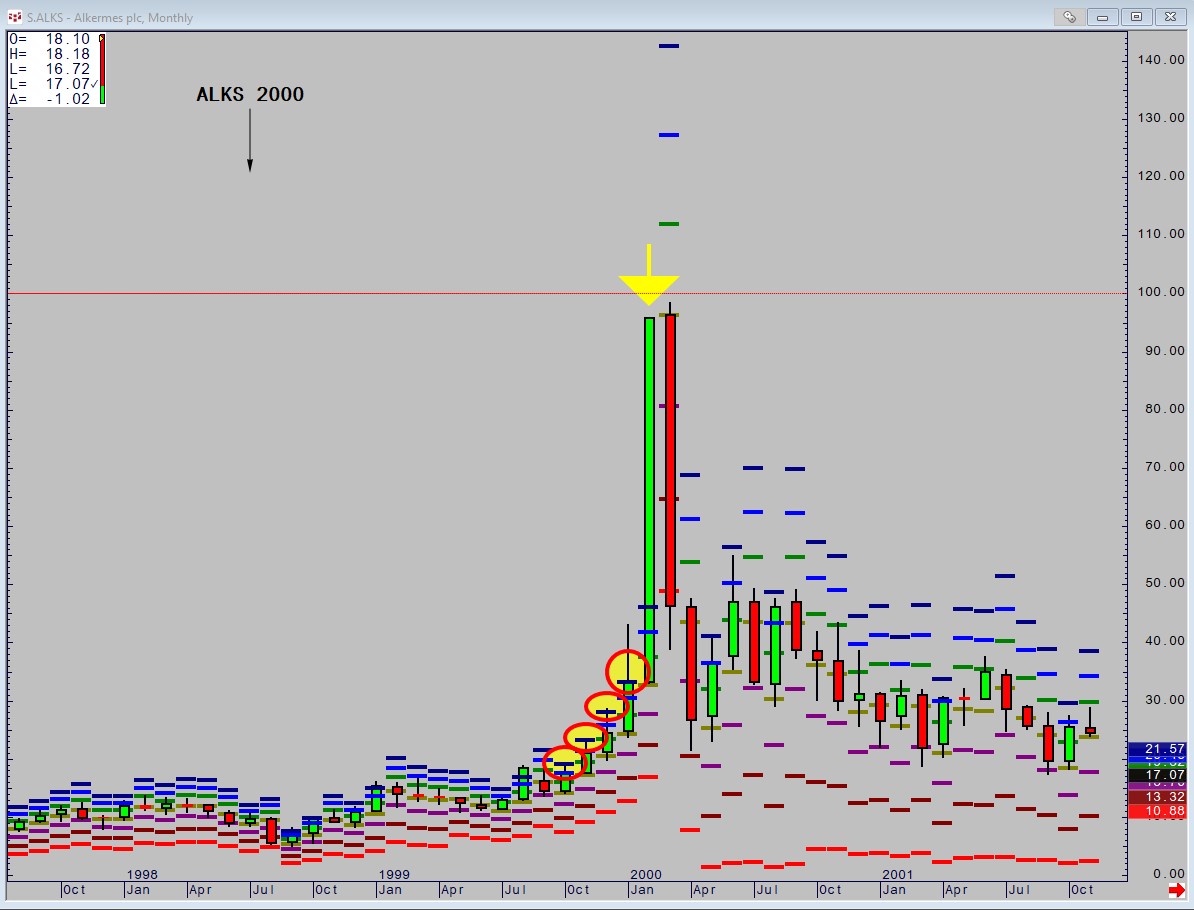
ALKS in 2000:
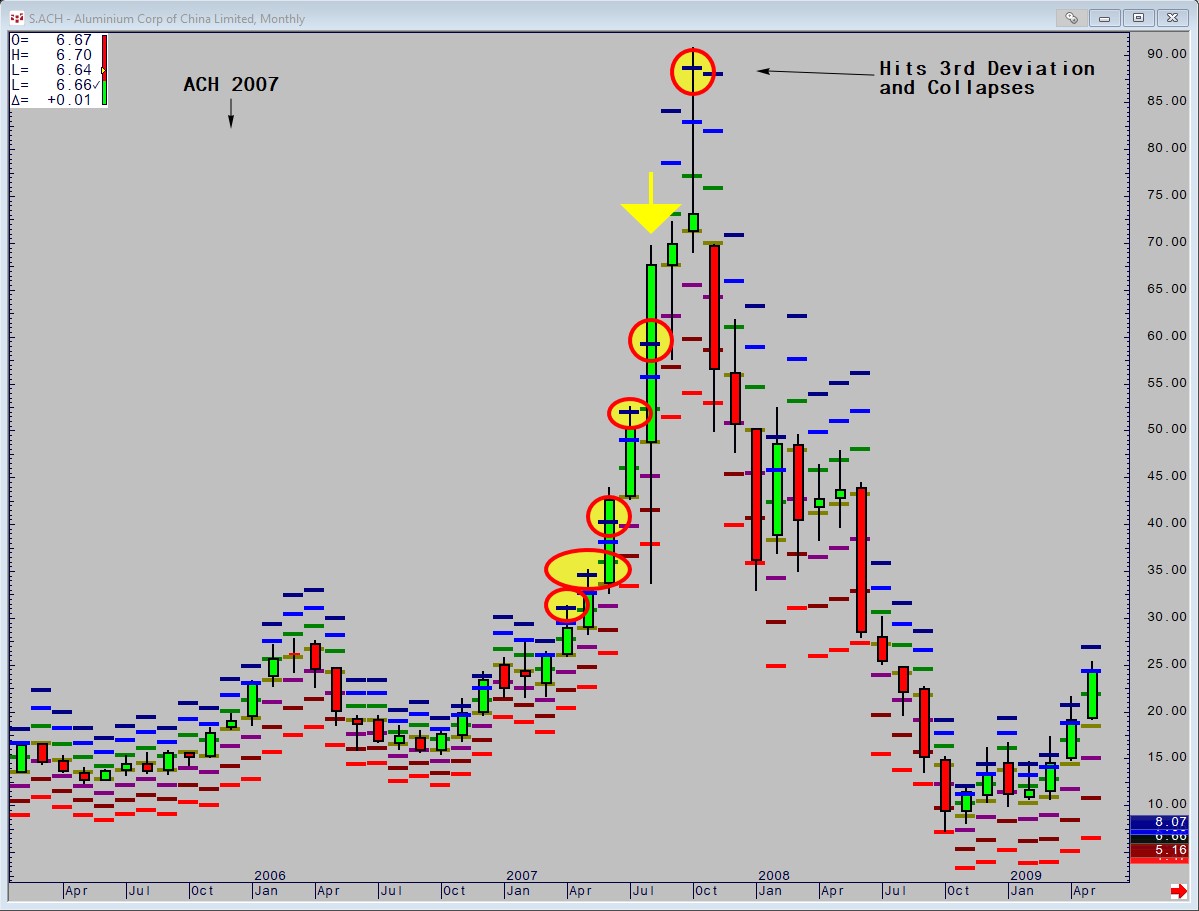
Aluminium Corp of China (ACH) in 2007:
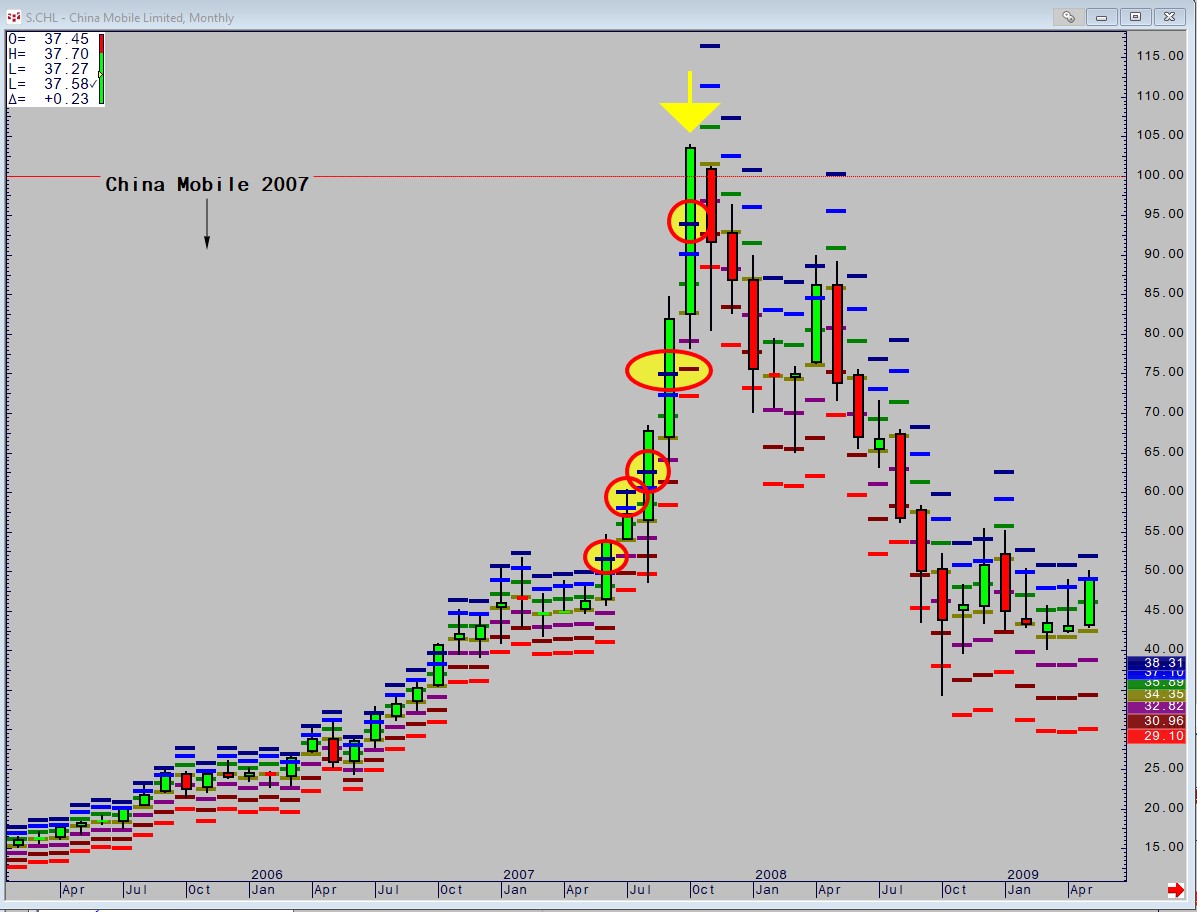
China Mobile (CHL) in 2007:
And finally, OSTK in 2017:
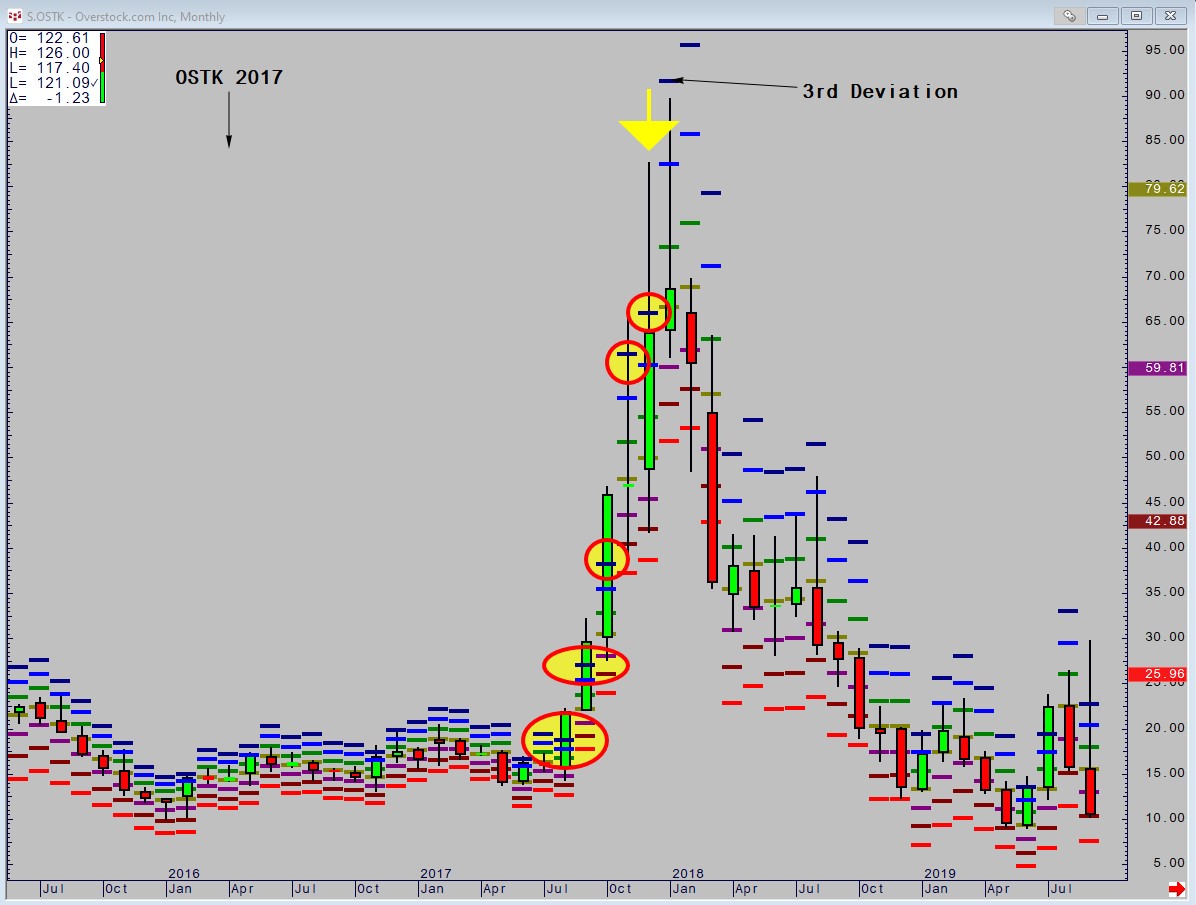
Of those 8 stocks, only GLW managed to continue higher in any meaningful way and, after a pause for reflection, it hit the 3rd Deviation up once more and then collapsed.
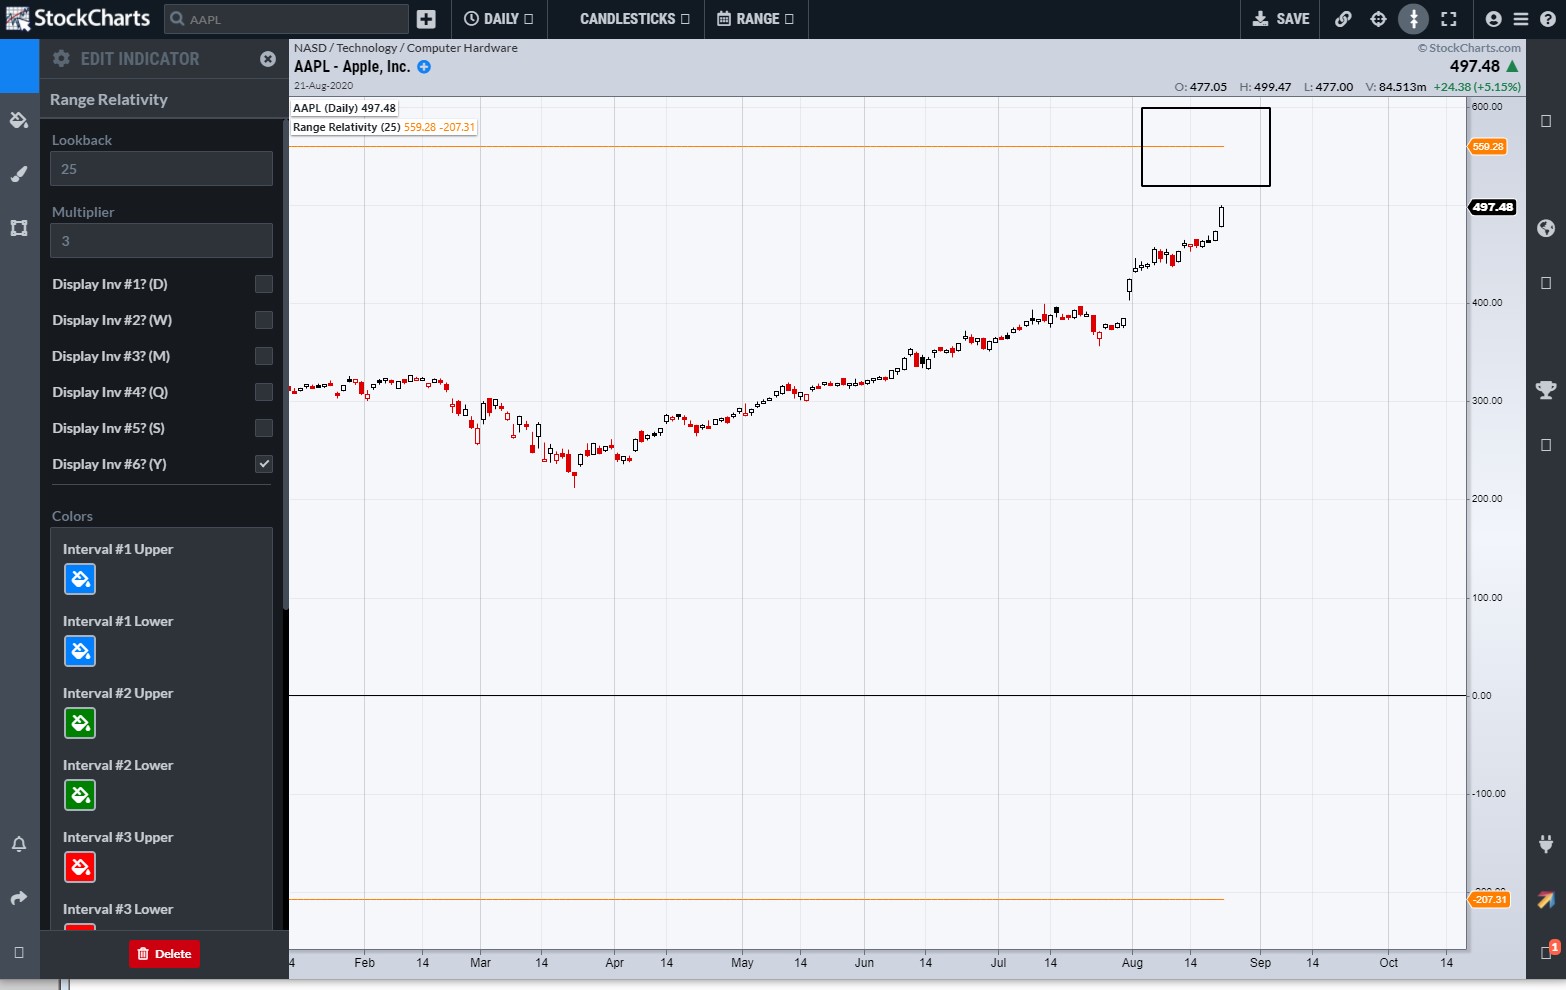
Of course, where Apple is different is that it is the biggest stock in the market and, therefore, the implications are far more significant for the market. Thus far, there are no indications of a reversal in Apple or the overall indexes. However, no stock has ever reached the 3rd Deviation 6 months in a row and Range Relativity shows that the 3rd Deviation annual target is up at $559.28. Note that Amazon's annual 3rd Deviation is close at $3447.
Range Deviation Pivots are in the Free starter pack on StockCharts, so, at the beginning of September, we will be able to see what the 1st, 2nd and 3rd deviations levels are for that month. At that point, I will have a clear framework of what the extremes are. What is clear now is that the risk of being long on the American Stock Market is becoming increasingly dangerous. I will update Apple again at the beginning of September.
I can be contacted at shaun.downey@aol.com to answer any questions.
Shaun Downey