Last month's article on Apple (AAPL) highlighted how it had made the almost unprecedented step of hitting its 3rd Monthly Deviation upward target for 5 months in a row. Armed with the knowledge that no stock in my test had ever done it 6 times meant that this month's extremes would have particular relevance, not only to the stock but the market as a whole.
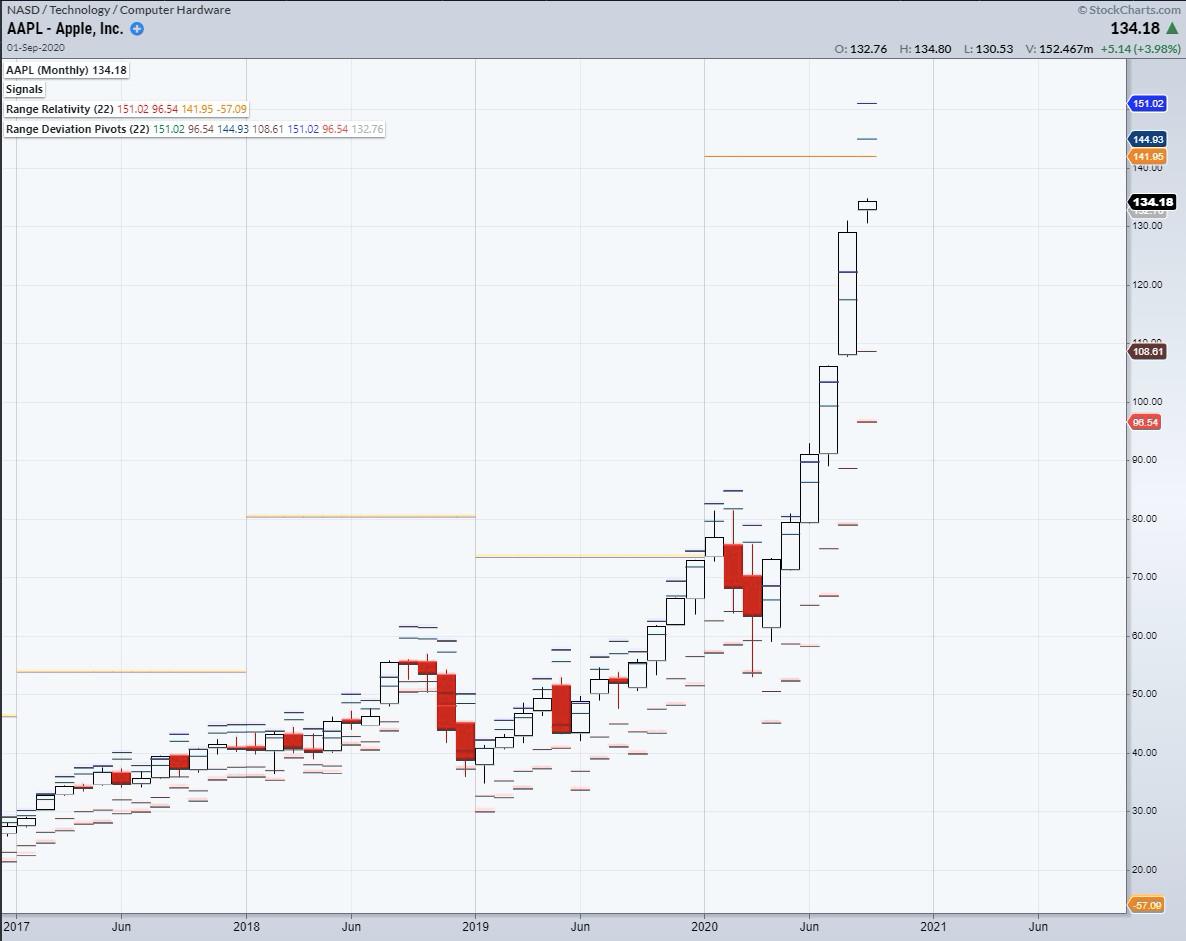
Starting with the Monthly chart, I have placed the Range Deviation Pivots and the Range Relativity. Beginning with the latter study, its 3rd Deviation Annual Target (yellow line) lies just above at $141.95. This represents a formidable barrier. From that point lies the 2nd and 3rd Deviation Monthly levels at $144.93 and $151.02. Therefore, with price unlikely to reach that higher number, it creates a resistance zone beginning at 141.95.
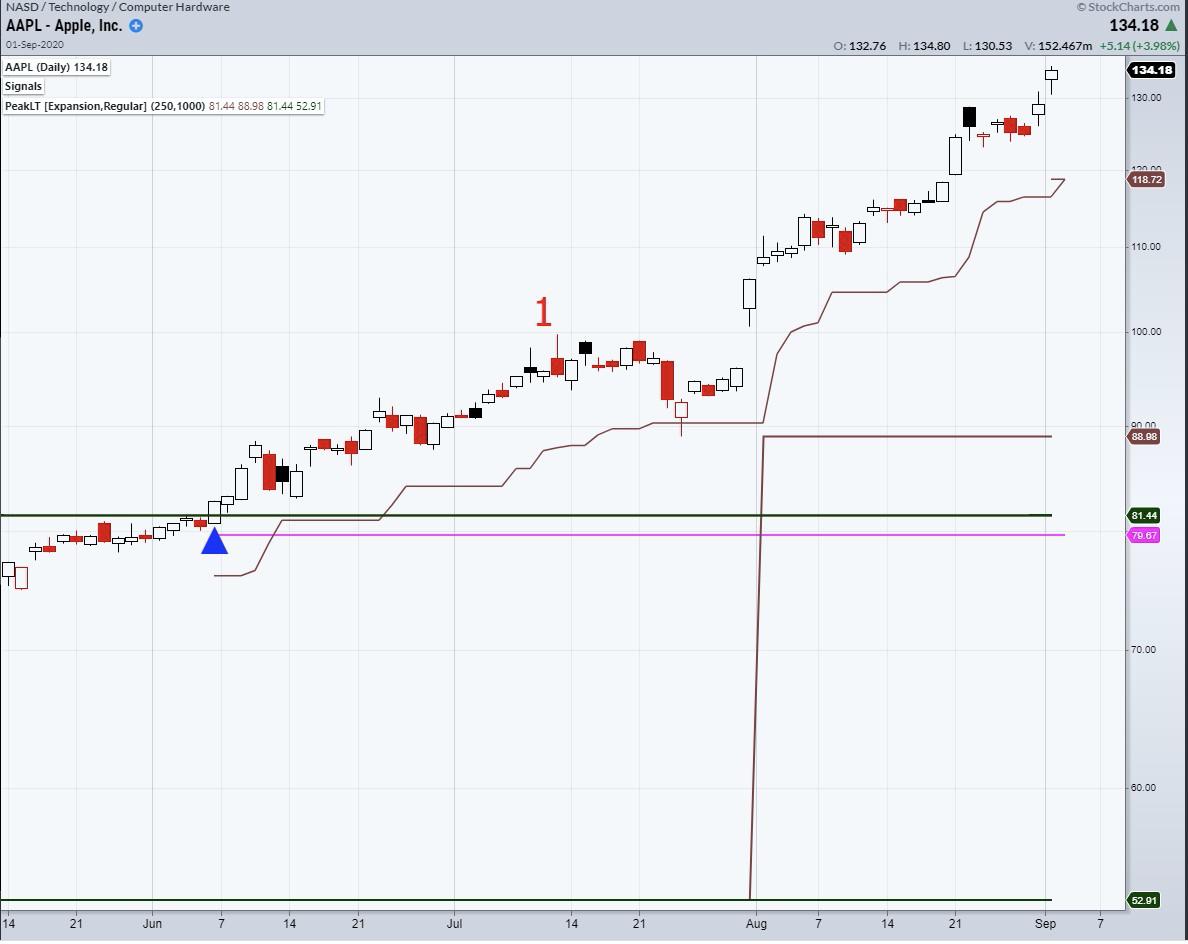
Moving down to the Daily Chart, the 4th Dimension System created a Buy signal (Blue triangle) back in June. Thus far, there has only been one Partial exit signal (No 1) in July and the Trailing Stop (Brown Line) has not been breached on a closing basis.
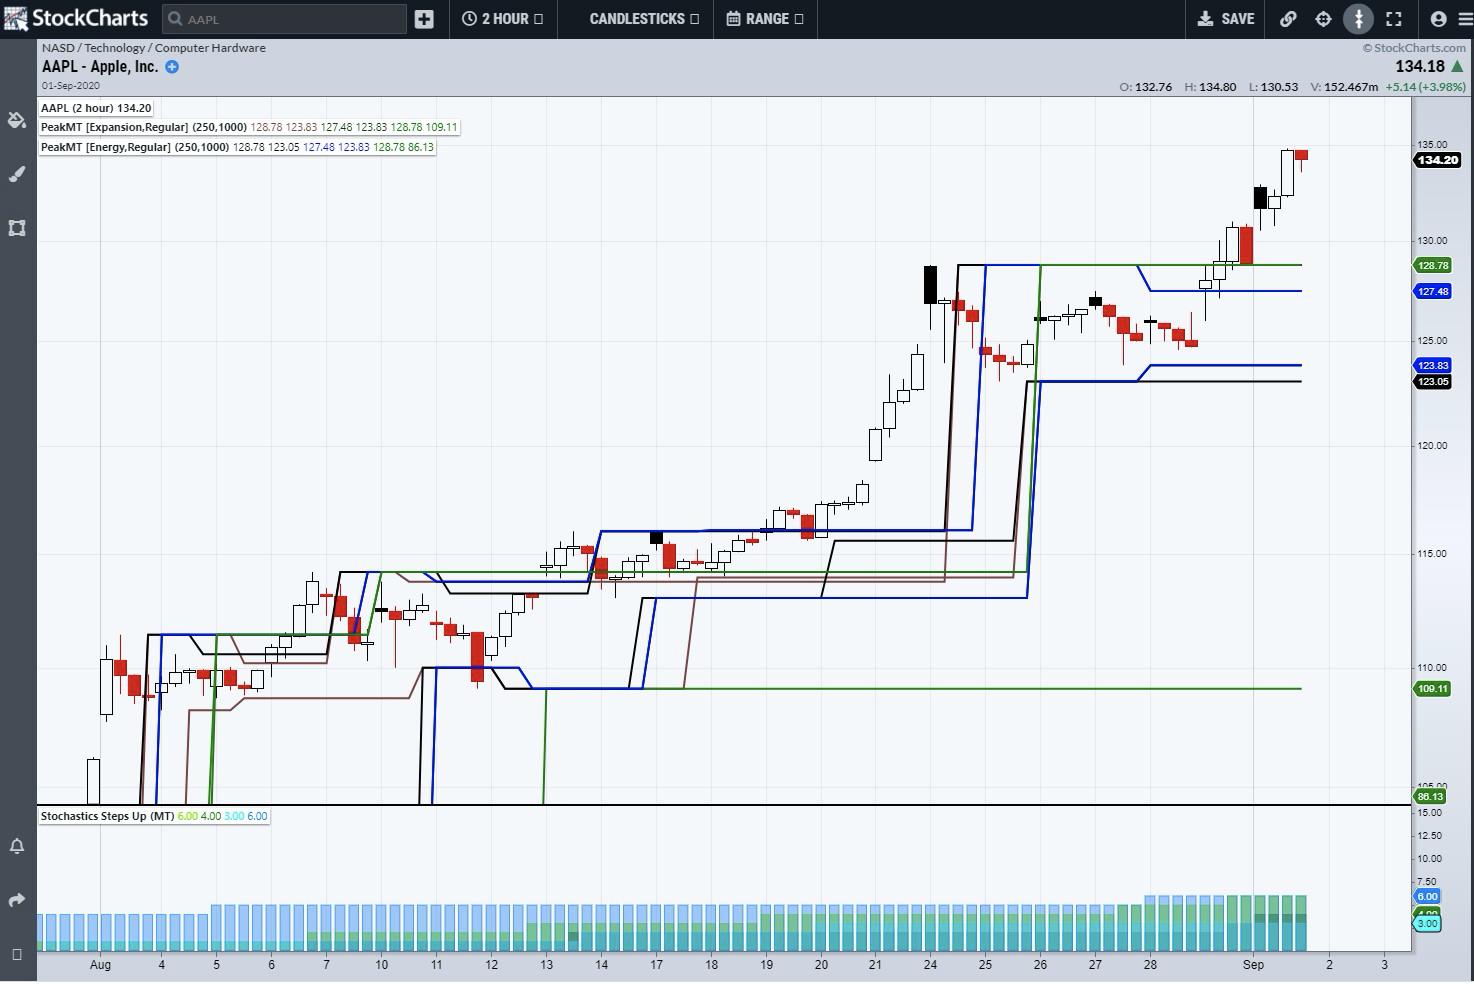
With price in such a rarefied atmosphere, it makes sense to move down to the two-hour chart. On this I have placed the intraday Peak Energy and Expansion studies and Stochastic Steps. The former tells me the short-term support points while the latter will tell me when the uptrend is over and there is no longer permission to be long. Currently, the stock is in Break Up mode with no resistance levels. The breakout point is the first support at $128.78. It would take a Daily Close below the other side of support, at $123.05, to tell me the trend was dead.
Stochastic Steps is plotting the trending process through, the 60-, 120-, 240- and 480-minute trends. Once a Step has reached 4, that is a trending timeframe, and I am fortunate enough to have two times meeting that criteria, thus enabling me to adjust risk as I see fit. If I wish to keep it tight as possible, the 60-minute (which is currently at 6) resetting to zero would tell me the trend is over. If I want to give it more room, the 480-minute is also at 6. If Apple moves higher into that zone, the obvious one to use is the 60-minute.
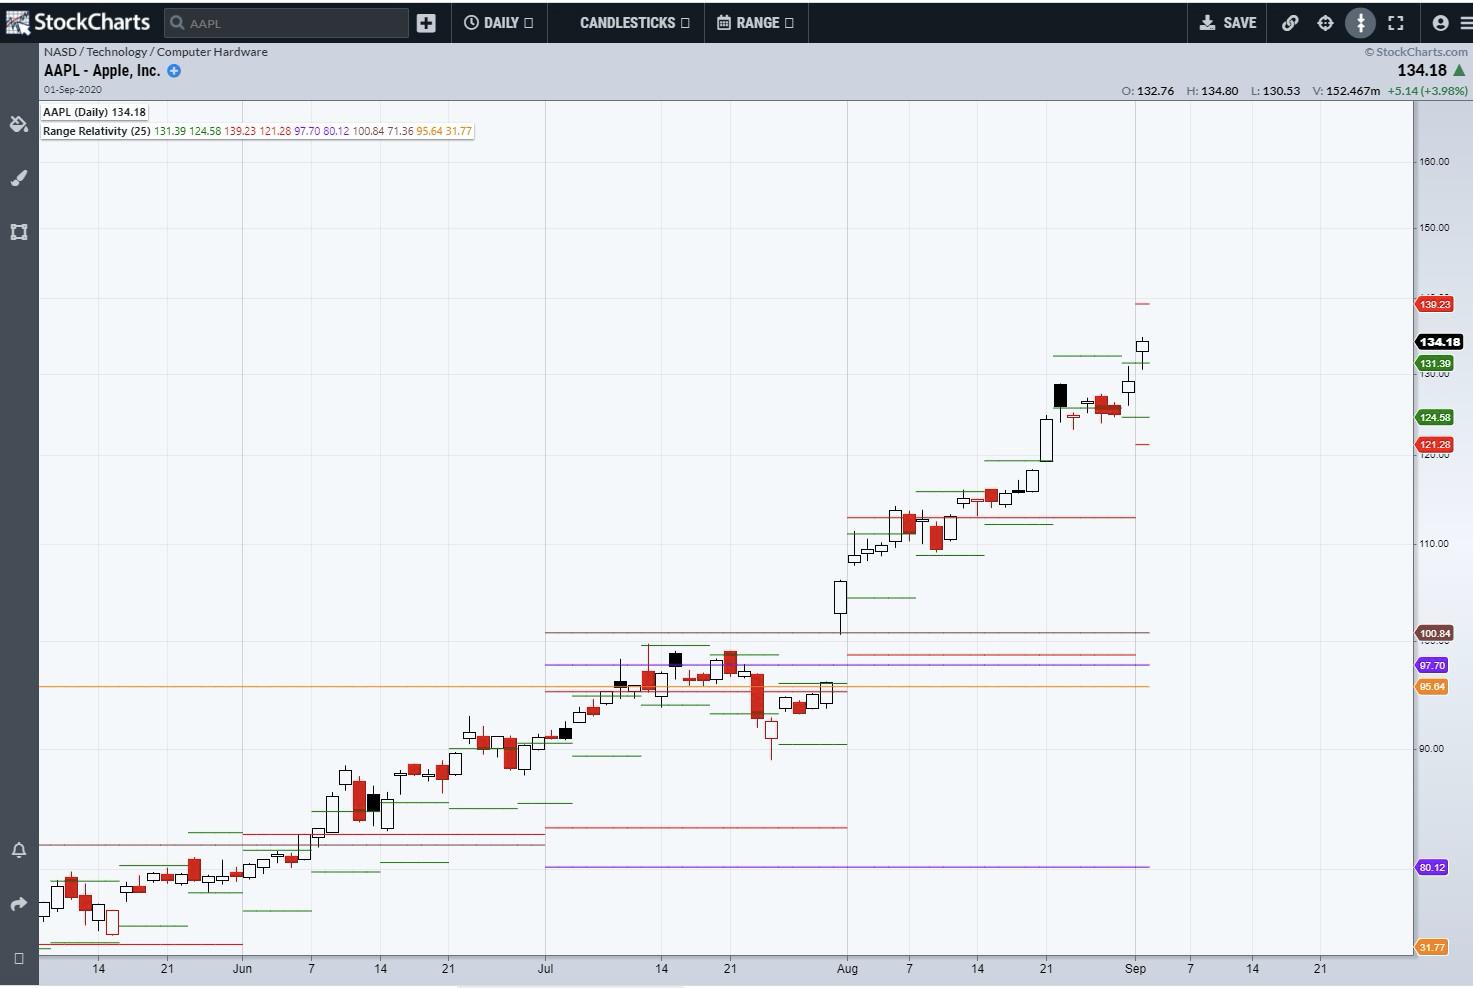
Finally, not surprisingly, there is the possibility of a Range Relativity Aggressive or Passive signal until the end of this month (Quarterly Values will reset in October). The trigger point is reset each week by price making a daily close below the weekly low value (green line). It is unlikely this week, but its value is $124.58. With the stock up again, the weekly breakdown point will rise accordingly on Monday.
I can be contacted at shaun.downey@aol.com to answer any questions.
Shaun Downey