The past week fared better than the one prior as the market added more to its gains. A major portion of the weekly gains was posted in the first half, while the last two sessions were spent amid consolidation. In a 4-day week, the headline index NIFTY50 ended with weekly gains of 171.90 points (+1.58%).
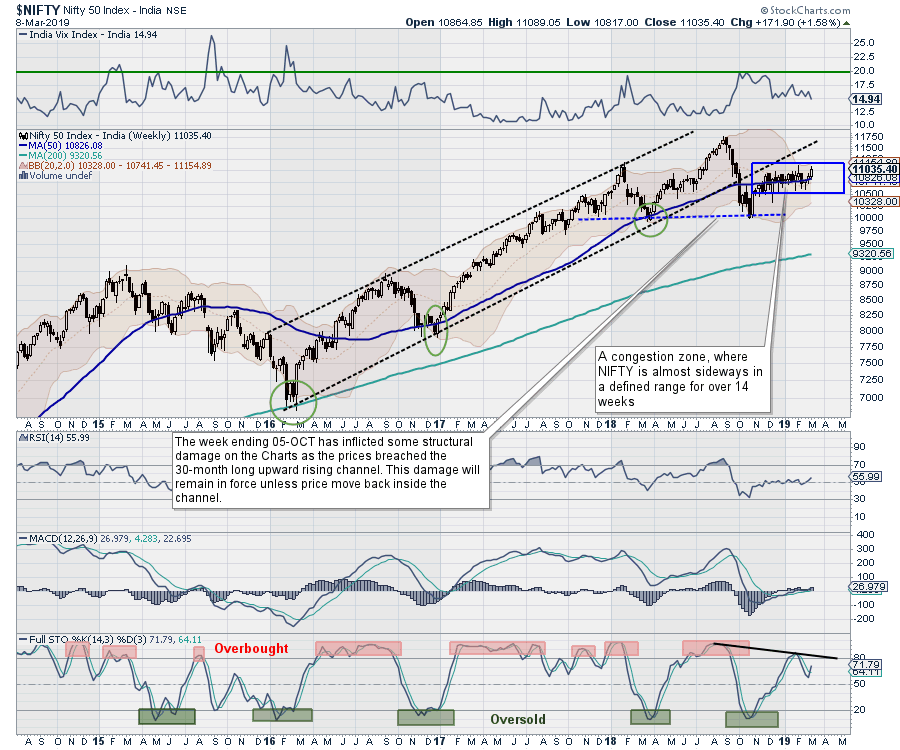 After deliberating for 15 weeks around the 50-Week MA, the NIFTY is now attempting to inch higher. However, it is concerning to see divergent signals on the daily and weekly charts. On the weekly chart, NIFTY is attempting to move out of a 15-week-old congestion zone, but, on the daily chart, the index is seen wearying at higher levels and is very likely to experience consolidation over immediate short term.
We expect a stable start to the coming week. However, given the present structure of the daily chart, we will see some consolidation persisting in the markets, at least at the beginning of the week. We will also see NIFTY resisting at the immediate past high point on the weekly chart (around 11110) and, in the event of any consolidation from higher levels, the 50-Week MA, which is presently at 10826, will come in to lend support.
The coming week is likely to see the levels of 11110 and 11200 acting as resistance points. Supports come in at the 10826 and 10700 level. The trading band for the coming week may remain wider than usual.
The weekly RSI is 55.9864. It has marked a fresh 14-period high, though it does not show any divergence against the price. The weekly MACD continues to trade above its signal line. Apart from a white body that emerged on candles, no significant formations were observed.
The pattern analysis of the weekly chart shows the NIFTY attempting to move out of the 15-week old congestion zone it has created for itself. However, it has not moved out comprehensively and will need to make a lot of effort before it breaks out from this zone.
All and all, though the NIFTY remains comfortably poised on the weekly charts as of now, it is showing very evident signs of slowing down on the shorter timeframe charts. We expect this indecisive mood of the markets to persist in the coming week, which continues to keep NIFTY vulnerable to selloff from higher levels. The vulnerability of the markets witnessing the profit-taking bouts has increased, as the volumes over the past couple of days have remained lower than average. The market breadth, too, is not performing as strongly as it should. We suggest remaining selective while approaching the markets, as good performance is likely to remain limited to only select pockets of stocks.
Sector Analysis for the Coming Week
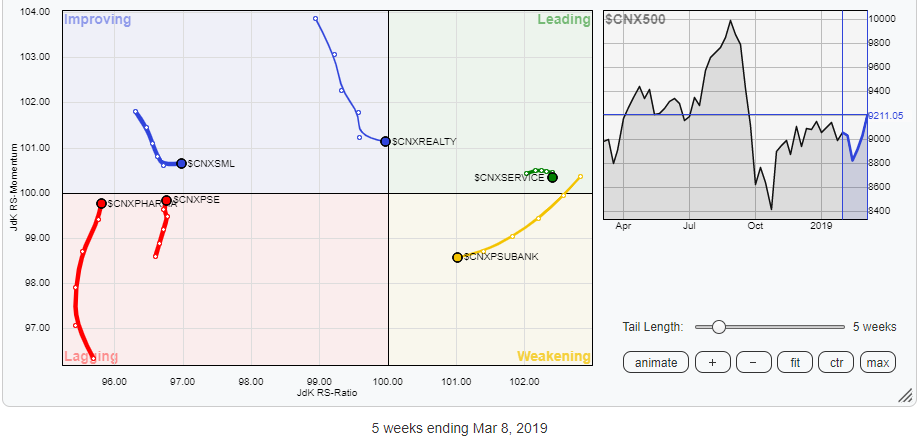
In our look at Relative Rotation Graphs, we compared various sectors against CNX500, which represents over 95% of the free float market cap of all the stocks listed.
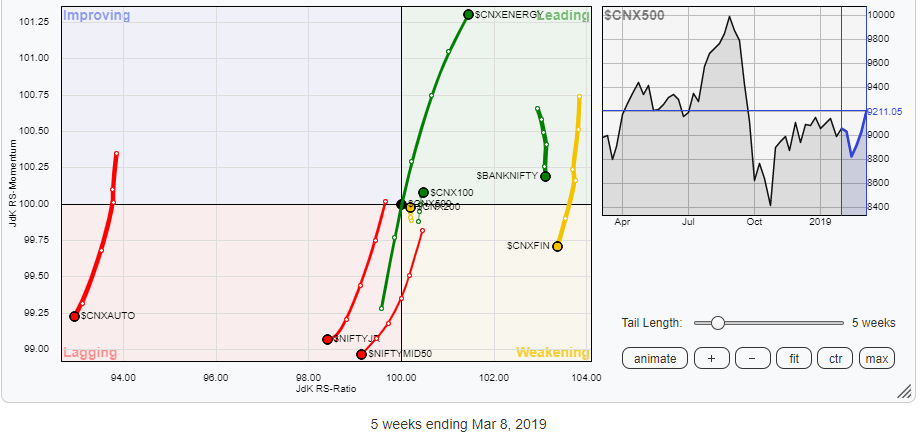 While reviewing Relative Rotation Graphs (RRG), it is evident that the CNXIT and CNX Energy indexes will continue to outperform the broader markets, as they are strongly advancing while remaining in the leading quadrant. The CNX100 index is also in the leading quadrant, but is not moving at much more than a crawl. This group may not distinctly out-perform, but may help in keeping the deterioration of market breadth into check.
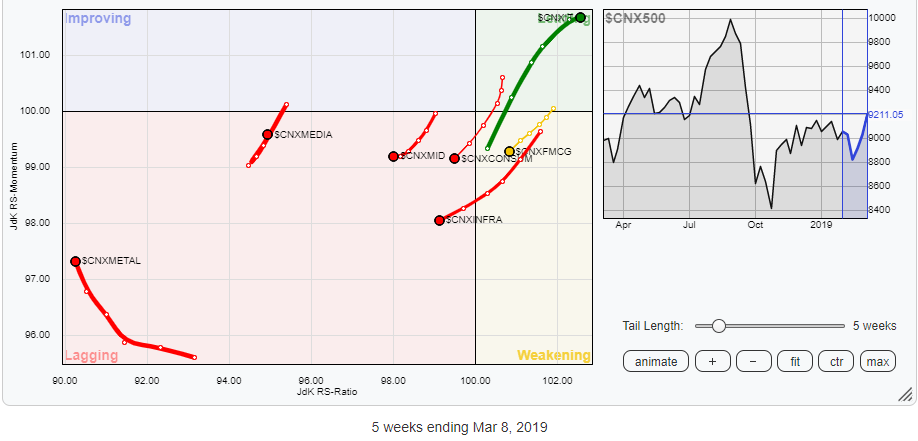
Apart from this, the Pharma, PSE and Metal groups are seen continuing to improve on the momentum front. These groups are expected to post resilient performance in the coming week. The CNXREALTY index is also attempting to enter the leading quadrant; it will need improvement in its relative momentum to put up the expected outperformance against the broader markets.
Meanwhile, groups like Bank NIFTY, Infrastructure, NIFTY MID50, Auto, Financial Services, Consumption and FMCG, along with PSUBanks, are seen drifting lower, steadily losing their momentum while remaining placed at differently positions on the RRG chart.
Important Note: RRG™ charts show you the relative strength and momentum for a group of stocks. In the above chart, they show relative performance as against the NIFTY500 Index (Broader Markets) and should not be used directly as buy or sell signals.
Milan Vaishnav, CMT, MSTA
Consulting Technical Analyst
www.EquityResearch.asia


