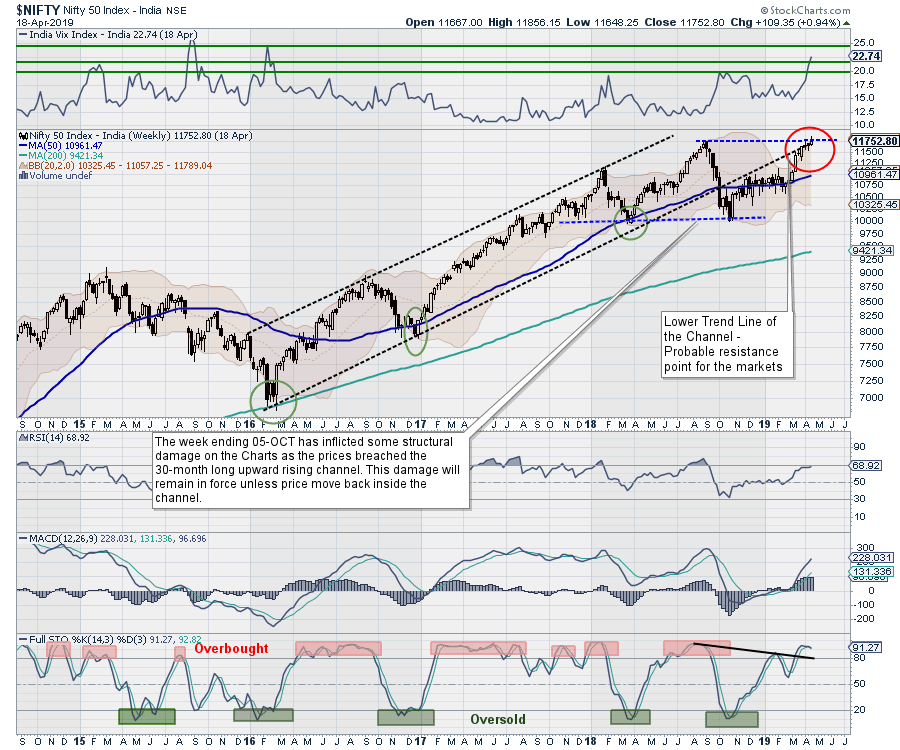
The past week was quite eventful for the Indian equity markets. The short 3-day working week saw the benchmark index NIFTY50 marking a fresh high and attempting a breakout. Along with that, it also saw the NIFTY not confirming this breakout, slipping below the all-important 11760 mark once again. This week was also the third week in a row where the markets did not make any major directional move, ending with a net weekly gain of 109.35 points (+0.94%).
The coming week will see the expiry of the current derivative series and is likely to remain volatile. The VIX is rising in an unabated manner and has climbed 8.27% this week to 22.74. These levels were seen before only in early 2016. Presently, the VIX remains at a multi-month high level, defying its usual negative/inverse relationship with the markets.
We need to approach the markets even more cautiously than before. As of today, the double top resistance at 11760 remains intact and has not been taken out. Even if mild positive moves are seen in the beginning of the week, they need to be dealt with a high degree of caution, as the lead indicators of the markets have been persistently showing a bearish divergence.
The coming week is likely to see the levels of 11850 and 11910 as immediate resistance points. Supports will come in much lower at 11600 and 11520.
The Relative Strength Index (RSI) on the weekly chart is 68.9221. The weekly MACD remains positive and is trading above its signal line. Apart from a white body that occurred on candles, no significant formations were seen.
With the earnings season in full swing, we will continue to witness stock-specific volatile actions in certain sections of the markets. The coming week will continue to remain stock-specific in nature. Markets will also keep an eye on the depreciating USDINR and rising crude prices. This, along with sharply rising volatility (VIX) is not going to make life easy for the markets going ahead. Keeping all these in mind, we suggest maintaining a highly cautious outlook in the coming days.
Sector Analysis for the Coming Week
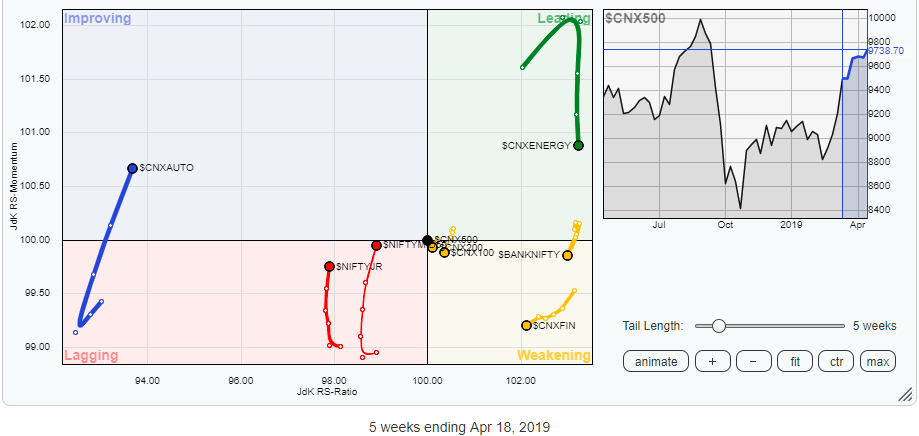
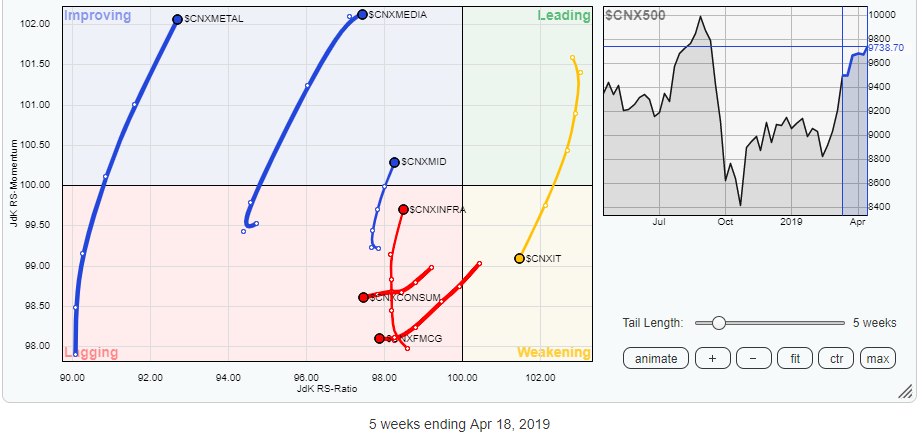
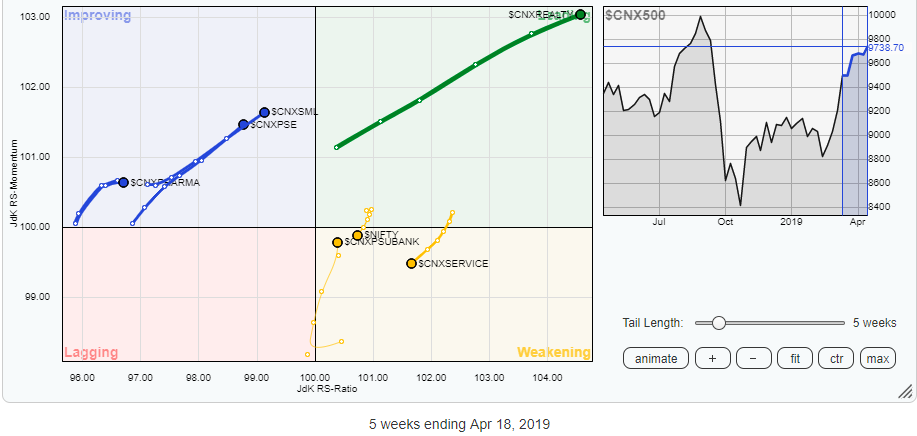
In our look at Relative Rotation Graphs, we compared various sectors against CNX500, which represents over 95% of the free float market cap of all the stocks listed.


 Our review of Relative Rotation Graphs (RRG) shows that, just like the previous week, outperformance is likely to remain limited to certain groups. The Realty group is firmly placed in the leading quadrant and is seen maintaining its momentum. The group is likely to relatively out-perform the broader CNX500. Along with this, other groups like Auto, Media, Metal, Pharma and CPSE are likely to show resilience. These groups are placed in the improving quadrant and continue to improve on their relative momentum.
Apart from the Realty index, the only index in leading quadrant is Energy. However, it is taking a sharp knock on the relative momentum front and is expected to weaken further. All other important indexes, such as BankNIFTY, the Services sector index, Financial Services, PSU Banks, Consumption and FMCG are seen drifting lower. No exceptional performance is expected from these groups.
Important Note: RRG™ charts show you the relative strength and momentum for a group of stocks. In the above chart, they show relative performance as against NIFTY500 Index (Broader Markets) and should not be used directly as buy or sell signals.
Milan Vaishnav, CMT, MSTA
Consulting Technical Analyst
www.EquityResearch.asia


